Profile of Reading
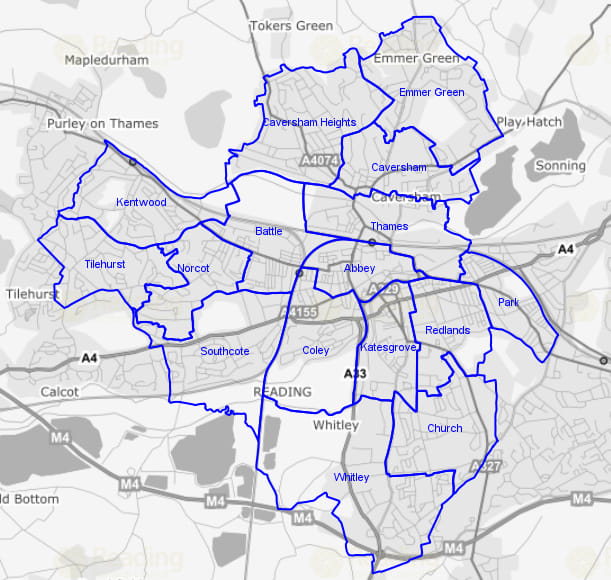
Reading is the principal regional and commercial centre of the Thames Valley, a major retail and leisure destination, with a thriving night-time economy.
There has been a huge shift in the town’s economy, from its origins in ‘beer, biscuits and bulbs’ to a compact service economy which specialises in business and insurance services, and has some of the finest high-tech business parks in the South East, with many international companies such as Microsoft and Oracle choosing Reading as their home.
The town is a major transport interchange, continuing to benefit from its strategic location on the M4 corridor and proximity to Heathrow Airport and London. Reading is also home to the University of Reading and Reading College, with a large percentage of the local working population highly skilled.
However, prosperity has brought its own problems, with pressure on infrastructure, communities and the environment. The high cost of living and, in particular, the high cost of housing, have had a significant impact on local communities. Although Reading can undoubtedly demonstrate success and wealth, the town also contains wards amongst some of the most deprived in the country.
Population and households
Currently 182,907 residents1 67,700 households2) are estimated to live within the Reading borough boundary, while around 233,000 people live in Reading’s greater urban area3. The population increased by 11.9% between 2021 and 2011, and a further 5% by 2024, while the number of households rose by 7.6%4 between 2021 and 2011.
Reading’s demographic composition has been changing, with both older and younger age groups increasing. Residents aged 65+ increased by 17.2%% between 2011 and 2021, while those aged under 15 increased by 8.6%.5
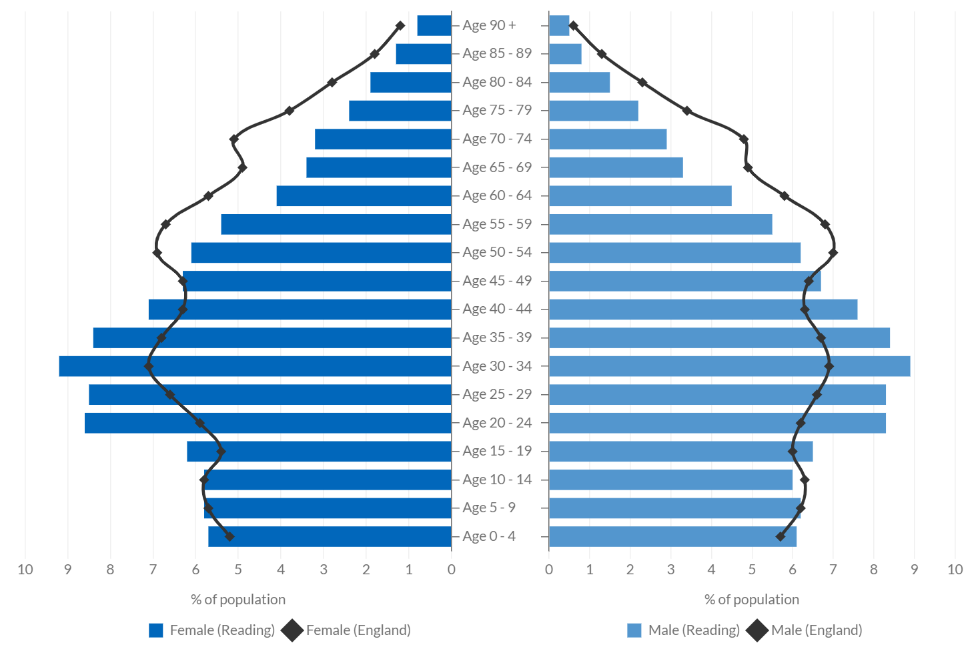
Population estimates and projections
| Age range | 2023 number | 2023 % | 2011 |
|---|---|---|---|
| 0-4 | 10,622 | 5.8% | 5.9% |
| 0-15 | 34,635 | 18.9% | 18.9% |
| 16-64 | 126,045 | 68.9% | 69.1% |
| 65+ | 22,227 | 12.2% | 12.0% |
| 80+ | 6,302 | 3.4% | 3.3% |
| Total | 182,907 | N/A | N/A |
Household composition
| Household composition | Reading 2021 | England 2021 | Reading 2011 |
|---|---|---|---|
| One person | 28.5% | 30.1% | 30.6% |
| With pensioner/s | 14.6% | 22% | 14.7% |
| Couple with no children | 16.8% | 16.7% | 17.3% |
| Couple with dependent children | 20% | 18.9% | 19.3% |
| Children with non-dependent children | 5.3% | 6.3% | 4.6% |
| Lone parent | 10.9% | 11.1% | 10.8% |
Sources: 2021/2011 Census. ONS
1ONS mid year estimates for 2023
2ONS Census 2021
3Local Transport Plan 2011-2026
4ONS Census
5ONS Census
Ethnicity
Reading has a very diverse population, with 46.5% now belonging to a Black and Minority Ethnic community (including white and other communities), the joint second highest proportion in the South East after Slough and with Oxford (2021 Census, Office for National Statistics), and up from 35% in 2011.
All ethnic groups have increased since 2011 apart from British, Irish and Black Caribbean. There has been a significant increase in the number of Romanian speakers since 2011.
| Ethnicity | Reading 2021 | England 2021 | Reading 2011 |
|---|---|---|---|
| White British | 53.5% | 73.5% | 65.3% |
| Other White | 13.7% | 7.5% | 9.5% |
| Mixed | 5.1% | 3% | 4% |
| Indian | 6.2% | 3.3% | 4.2% |
| Pakistani | 4.8% | 2.8% | 4.5% |
| Other Asian | 6.7% | 3.5% | 4.9% |
| Black Caribbean | 1.9% | 1.1% | 2.1% |
| Black African | 4.4% | 2.6% | 3.9% |
| Black other | 4.5% | 2.9% | 4.5% |
| Chinese | 1.5% | 0.8% | 1% |
| Other ethnic group | 2.8% | 2.2% | 1% |
Source: 2021 Census, Office for National Statistics
Language
| Language | Count 2021 | Count 2011 |
|---|---|---|
| English | 136436 | 126,690 |
| Polish | 4154 | 3,768 |
| Nepalese | 4147 | 2,430 |
| Romanian | 2642 | 194 |
| Urdu | 1520 | 1,790 |
| Portuguese | 1512 | 655 |
| Spanish | 1264 | 585 |
| Italian | 1024 | 450 |
| Arabic | 985 | 600 |
| Panjabi | 968 | 921 |
Economy, employment and skills
Over the last 20 years, Reading has developed from an economy based on trading and manufacturing into a centre for leading edge information communication technology (ICT) companies and is now one of the largest insurance and business service centres in the country. Reading is now a major retail centre, with a significant evening economy.
Pre-COVID, unemployment was low, and although it is now higher, it is still just below the national average. Reading has a highly skilled workforce, with more jobs than workers, however there is a disparity in terms of skills and earnings between the workforce and Reading residents, with in-work poverty increasing for residents.
Reading’s occupation profile has changed since 2011 census, with professional and managerial occupation types showing the most significant increase. Some service and elementary occupations have increased and administrative occupations decreased.
- Reading appears within the top 10 UK cities for the Centre for Cities Good Growth Index. Reading scores above average in terms of jobs, income, health and skills.
- The average (mean) gross annual salary7 for workers in Reading in 2025 was £49,799 for residents, higher than the national average but lower than the South-East average for residents, and £61,467 for workers, higher than both South-East and England.
- In terms of unemployment8, the claimant count rate is currently 4.3% (Nov 25), higher than the rates for both the South-East and England9. This is a slight decrease on the Nov 2024 figure of 4.4%.
7 NOMIS; Annual Survey of Hours and Earnings (full time workers)
8 proportion of working age population claiming JSA or Universal Credit
9 NOMIS
Qualifications – updated summer 2023
| Highest level of qualification | Reading 2021 | England 2021 | Reading 2011 |
|---|---|---|---|
| No qualifications | 15.8% * | 18.1% | 17.4% |
| Level 1 qualifications | 9.1% | 9.7% | 12.2% |
| Level 2 qualifications | 10.7% | 13.3% | 12.3% |
| Apprenticeship | 4.1% | 5.3% | 2.5% |
| Level 3 qualifications | 16.8% | 16.9% | 13.4% |
| Level 4 qualifications and above | 40.4% | 33.9% | 34.8% |
| Other qualifications | 3% | 2.8% | 7.4% |
Source: 2021 Census, Office for National Statistics (% of residents aged 16-74)
Housing
Reading’s continued success has further increased demand for housing, resulting in higher than national average prices, with the median house price now around 3 times higher in March 2023 than March 2001 (ONS house price statistics for small areas, 1995 – 2023). Because of this, the property market has become increasingly inaccessible to those on low incomes, due to the shortage of affordable housing.
| Housing tenure | Reading 2021 | England 2021 | Reading 2011 |
|---|---|---|---|
| Owner occupied | 50.4% | 61.3% | 54.8% |
| Shared ownership | 1.3% | 1% | n/a |
| Social rented | 16.1% | 17.1% | 16.3% |
| Private rented | 31.9% | 20.5% | 26.1% |
| Rent free | 0.2% | 0.1% | n/a |
Source: 2012 Census, Office for National Statistics
| Location | Median house price | Median detached house price | Median semi-detached house price | Median terraced house price | Median flats/maisonette price |
|---|---|---|---|---|---|
| Reading | 351,250 | 645,000 | 430,000 | 337,500 | 245,000 |
| England | 300,000 | 422,500 | 277,500 | 246,050 | 248,000 |
Source: LG Inform Plus, 2025 Q1 (rolling)
Deprivation
Although the pace of change in Reading has been rapid, there is a clear mismatch between outstanding economic success and the level of benefits to local people, leaving a significant gap between Reading’s most and least prosperous neighbourhoods. Reading has, within a small geographic area, some of the most affluent and the most deprived neighbourhoods in the whole of the Thames Valley.
- Reading is below the national (UK) level in terms of child poverty, with just under 1 in 6 children, or 17%, in relative poverty. This is a increase on 16.3% in the previous year12, and follows the general trend since 201513.
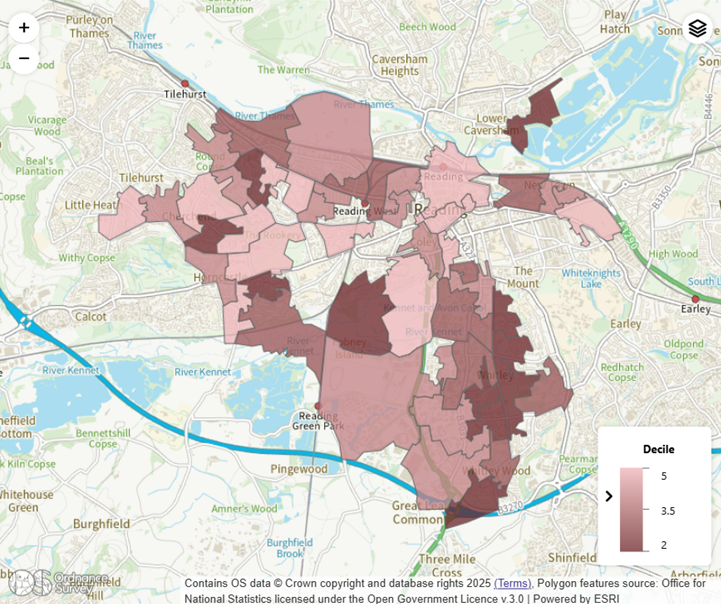
- According to the latest Index of Multiple Deprivation (2025), Reading as a whole is ranked the 147th most deprived out of 296 local authorities in England, which puts Reading on the 50th percentile, i.e. average. There are no longer any Lower Super Output Areas (LSOAs) within the most deprived 10% nationally (compared with 5 in 2019).
- In terms of the Census 2021 deprivation dimensions, Reading has a slightly higher % households deprived on all 4 dimensions (0.3%) than nationally (0.2%), but also a high % not deprived on any dimension (52% compared with 48% nationally). Fewer households are deprived than in 2011.
Index of Multiple Deprivation 2019
12 DWP 2024
13 With the exception of a dip in 2020
Health
In general terms, Reading tends to score better than the national average for most health measures, although this hides problems amongst particular communities.
- The difference in life expectancy between males living in the most and least deprived areas of Reading is 8.8 years, whilst among females, the gap is 8.2 years14
- For further information on health see Reading’s Joint Strategic Needs Assessment (JSNA) for Reading
| Location | Proportion of population reporting good or very good health | Proportion of population reporting limiting long-term illness |
|---|---|---|
| Reading 2021 | 85.6% | 13.8% |
| England 2021 | 82.2% | 17.3% |
| Reading 2011 | 85.5% | 13% |
Source: 2021 Census, Office for National Statistics
Crime
Crime and the fear of crime have become more significant issues as Reading’s evening economy has grown over recent years. However, Reading has a fairly average crime rate, when compared our most similar group of Community Safety Partnerships.
- 17,349 crimes were reported in 2024/25, or 99.2 102.3 crimes per 1000 population, an 2% decrease on the previous year, and the second highest rate in the Thames Valley after Oxford15.
- Violent crime has decreased by 4% since the previous year to 34 crimes per 1000 population, third highest in the Thames Valley.
- Theft offences stand at 39 crimes per 1000 population, a slight decrease since the previous year, and the second highest in the Thames Valley.
14 2021-23 Reading JSNA
15 ONS 2024/25
Transport and travel to work
Reading is a major population and employment centre within the South East, benefiting from close proximity to London and Heathrow, and with excellent links to national road and rail networks as well as to Heathrow Airport. Such connectivity is represented by Reading’s status as a regional transport hub and international gateway.
Reading is a major centre of employment, with more jobs than workers, which means there is a significant demand for travelling into Reading from other areas. Reading experiences congestion on many of its main routes during the week, with the commercial success of the town adding to weekend congestion.
- Reading is the 9th busiest station outside London, catering for 17 million passengers a year, with a further 4 million interchanging passengers (Reading Transport Strategy 2040).
- Despite having the third highest bus use in the country Reading remains one of the most congested towns in the UK, with car congestion in the area, causing the second highest levels of delays in any local authority outside London (Reading Transport Strategy 2040).
| Travel to work and car ownership | Reading 2021 | Reading 2011 | England 2021 |
|---|---|---|---|
| Travel to work by car or van | 31.4% | n/a | 44.5% |
| Travel to work on foot/ by cycle | 11.4% | n/a | 7.6% |
| Number of households with no car | 28.4% | 28.3% | 23.5% |
Source: 2021 Census, Office for National Statistics
Last updated on 21/01/2026
Profile of Reading