Annual Monitoring Report 2019-20
Contents
Executive summary
- The Annual Monitoring Report reports on key information relating to planning policy issues in Reading on an annual basis, both in terms of the progress of new policy documents, and the effects of the policies that already exist. This Annual Monitoring Report covers the period from 1st April 2019 to 31st March 2020.
- The main outcomes for the monitoring year are outlined below.
- Policy Progress: The main achievement this year has been the adoption of the new Reading Borough Local Plan. This has allowed further progress on accompanying Supplementary Planning Documents, with a Palmer Park Development Framework and Sustainable Design and Construction SPD also reaching adoption. Progress on the Joint Minerals and Waste Local Plan is some way behind the Local Development Scheme dates.
- Duty to Co-operate: Work on duty to co-operate measures have been much more limited than in the previous year, as the Local Plan was recently adopted. The Council’s duty to co-operate efforts have mainly been focused on the plans of other authorities.
- Contributions to Infrastructure: 2019-20 has seen by far the highest amount of CIL receipts so far, at £8.98 million, almost double the previous highest level. This year has seen around £1.75 million of CIL spend.
- Economic Development: There has been an overall very small net gain of employment floorspace in 2019-20, although new permissions granted this year would result in a net loss. New floorspace permitted and completed has generally been in line with the Council’s spatial policies.
- Housing: Numbers of new housing completions have been lower than the very high levels of 2018-19, and have fallen below Local Plan targets for this year, with 521 homes completed in 2019-20 compared to a Local Plan target of 689. As there is a very high number of dwellings under construction, this is not considered likely to be a long-term trend. Reading has a five year supply of housing when measured against targets in the new Local Plan. Delivery of affordable housing has reduced compared to last year, and remains a significant way below Reading’s needs.
1 Introduction
1.1 The Annual Monitoring Report reports on key information relating to planning policy issues in Reading on an annual basis. The purposes are to monitor the progress of the Local Development Scheme (LDS) including the positions of planning policy documents; to review the performance of the Local Plan in relation to key policy targets (indicators) set out in the documents; and to determine the extent to which objectives, targets and programmes are being met to inform and guide the development of future plans and policies.
1.2 This Annual Monitoring Report covers the period from 1st April 2019 to 31st March 2020. It provides a concise summary of key statistical information which considers the impact of the Local Plan policies.
Context to the AMR 2019/20
1.3 The production of a single Annual Monitoring Report containing a range of planning monitoring information is no longer a statutory requirement. However, there remains a requirement for continuous reporting of important monitoring information, and therefore Reading Borough Council has continued to produce a monitoring report on an annual basis, as it has proven a helpful format for reporting information.
Approach and Structure of the Report
1.4 This report looks first at progress on the process of plan making, and then moves on to monitor the effects of policies. By and large, the report focuses on data collected by the Council rather than third party data which is available in public elsewhere. The report does identify and provide links to online sources where data about Reading has been collected.
1.5 The report is structured broadly into two key elements, which comprise monitoring policy progress and monitoring policy performance. The main sections of this report include:
- Introductory comments;
- A description of the current planning policy framework for Reading and, progress made with regard to the Local Development Scheme (LDS) since April 2019 including the status of the Local Plan and Supplementary Planning Documents (SPDs). This includes actions taken under the duty to co-operate;
- Monitoring indicators relevant to the adopted Local Plan documents.
1.6 Section 2 of the Reading Borough AMR for the monitoring year 2019-20 reviews the progress of the Local Development Scheme (LDS) with respect to the outlined milestones and, the progress on the implementation of policies contained in adopted Local Plan documents. Section 3 deals with the duty to co-operate, reporting on which is a statutory requirement. Section 4 refers to key monitoring information for the new Local Plan.
1.7 Section 5 onwards of the AMR 2019-20 considers the status of key policies and related targets within the adopted Reading Borough Local Plan and monitors how those policies are being implemented.
1.8 The requirements under the Community Infrastructure Levy Regulations 2010 (as amended) to monitor measures related to CIL are now fulfilled in a separate Infrastructure Funding Statement, but summary information is included in section 6.
1.9 The housing trajectory for 2019-20 and headline indicators relating to housing monitoring are included in section 8 of the AMR. Information included relates to housing delivery, development on previously developed land, affordable housing and housing mix. The recent developments in business, retail and leisure development are also outlined through appropriate indicators in sections 7 and 9.
1.10 The data sources for compiling this report include commitments monitoring information for Residential and Non-Residential published by the Council in 2020, and information from sources such as the Office of National Statistics (ONS) and Thames Valley Environmental Records Centre.
Sources of background information and data on Reading
1.11 Major sources of third party data and comparative information about Reading also include the Office of National Statistics’ NOMIS service, which provides labour market statistics by local authority area. Data for Reading can be found here.
2 Monitoring policy progress
2.1 This Section evaluates the progress of Local Development Documents (LDDs) evolving under the Local Development Scheme (LDS), and examines the extent to which those documents have progressed in relation to the targets set out in the LDS.
2.2 The most up-to-date LDS at the start of the monitoring year was the version produced in November 2016, the focus of which was the production of a comprehensive Local Plan. This is therefore the version against which progress is monitored in this section.
2.3 In summary, the three main planning policy documents already in place at the start of the year are detailed below.
2.4 Core Strategy: The Core Strategy was adopted in January 2008. It was amended in January 2015 to accommodate changes to the affordable housing policy CS16.
2.5 Reading Central Area Action Plan (RCAAP): The RCAAP was adopted in January 2009.
Table 1: Documents already adopted at 31st March 2019
| Document | Date adopted |
|---|---|
| Core Strategy | January 2008 |
| Reading Central Area Action Plan | January 2009 |
| Sites and Detailed Policies Document | October 2012 |
| Proposals Map | October 2012 |
| Statement of Community Involvement | March 2014 |
| Community Infrastructure Levy Charging Schedule | January 2015 |
| Affordable Housing SPD | July 2013 |
| Battle Hospital Planning Brief | April 2005 |
| Caversham Lock Area Development Principles | March 2006 |
| Chatham Street Development Brief | December 2002 |
| Dee Park Planning Brief | December 2008 |
| Design Guide to House Extensions | May 2003 |
| Elvian School Planning and Development Brief | February 2011 |
| Employment, Skills and Training SPD | April 2013 |
| Kenavon Drive Urban Design Concept Statement | July 2004 |
| Meadway Centre Planning Brief | November 2013 |
| Minster Quarter Area Development Framework | December 2018 |
| Parking Standards and Design SPD | October 2011 |
| Reading Prison Framework | March 2015 |
| Reading Station Area Framework | December 2010 |
| Residential Conversions SPD | November 2013 |
| Revised Planning Obligations under Section 106 SPD | November 2013 |
| South West Reading Planning Brief | April 2000 |
| Station Hill South Planning and Urban Design Brief | March 2007 |
2.6 Sites & Detailed Policies Document (SDPD): The Sites and Detailed Policies Document (and accompanying Proposals Map) was adopted in October 2012. It was also amended in January 2015 to accommodate changes to the affordable housing policy DM6.
2.7 Table 1 briefly summarises which Local Development Documents had already been adopted at the start of the monitoring year, and the date of adoption.
2.8 Table 2 sets out progress against the milestones that our 2016 Local Development Scheme expected to be reached between 1 April 2019 and 31 March 2020 (or outstanding milestones that had not been reached at the start of the monitoring year), and indicates whether these milestones were met or were missed.
Table 2 Progress against Milestones in the LDS, 2019-20
| Scheme | Stage | Planned milestones 2019/20 | Actual milestones | Milestone met |
|---|---|---|---|---|
| Local Plan | Inspector’s Report | September – November 2018 | September 2019 | No |
| Local Plan | Adoption | January 2019 | November 2019 | No |
| Other Site Development Briefs – Palmer Park Development Framework | Adoption | As required | April 2020 | Yes |
| Minerals and Waste Local Plan | Proposed Submission Document Consultation | November 2018 – March 2019 | September – October 2020 | No |
| Minerals and Waste Local Plan | Submission | Winter 2019 | TBC | No |
| Minerals and Waste Local Plan | Public examination | Spring 2020 | TBC | No |
2.9 Local policy: The main achievement in 2019-20 has been the adoption of the new Reading Borough Local Plan. The examination hearings had been completed in October 2018, but a post-hearing advice note was received in March 2019 that set out some additional evidence required and recommended some additional modifications. This was after the Council had written to the Planning Inspectorate in March 2019 expressing concern about the length of time that the process was taking. Consultation on Main Modifications took place in June and July 2019. A final Inspectors Report, concluding that the Local Plan was sound and legally compliant subject to a number of main modifications was received on 24th September 2019. The Local Plan was adopted on 4th November 2019, and replaced the Core Strategy, RCAAP, SDPD and associated Proposals Map.
2.10 The final adoption date was 10 months later than envisaged in the Local Development Scheme. Whilst submission took place only one month later than set out in the LDS, the examination process took considerably longer than expected, and led to the delay. There are three main causes of the delay in the examination process. Firstly, a large number of other authorities also submitted their Local Plans in March 2018, to meet a deadline of the end of March to avoid relying on the new standard housing need methodology, which meant that hearings did not take place for six months. Secondly, a significant amount of additional evidence was requested during the hearings. Finally, there was a delay in production of post-hearing advice, as outlined above.
2.11 Alongside the examination of the Local Plan, the Council was able to progress Supplementary Planning Documents for key sites and topics identified in the Local Plan.
2.12 In terms of site-specific SPD, the Palmer Park Development Framework, which had been subject to consultation prior to the monitoring year, was also adopted in November 2019.
2.13 With the declaration of a climate emergency in February 2019, the first priority for topic-specific SPD was to put a new Sustainable Design and Construction SPD in place. This had not been specifically referenced in the 2016 LDS. In order to ensure that there would not be a significant gap in policy, consultation on the draft SPD took place between July and September 2019, before the Local Plan was adopted. The SPD was then adopted in December 2019 following shortly after the Local Plan adoption, and replaced the previous Sustainable Design and Construction SPD from 2011.
2.14 Minerals and Waste Local Plan: The Council is working with Wokingham Borough Council, Bracknell Forest Borough Council and the Royal Borough of Windsor and Maidenhead on a joint minerals and waste local plan. A joint arrangement, which involved Hampshire County Council preparing the Central and Eastern Berkshire Minerals and Waste plan on behalf of the four authorities, was entered into in September 2016.
2.15 A Local Development Scheme for the Minerals and Waste Plan was agreed between the four authorities, and included as an appendix in the Council’s November 2016 LDS. The anticipated consultation on Preferred Options (January to May 2018) had already slipped in the last monitoring year and taken place between August and October 2018, which affected later milestones. In addition, there was a need to undertake additional consultation exercises as new sites were nominated and others withdrawn, which had further implications for the timeline. This meant that the proposed submission version due to be published towards the end of 2018-19 was still not published in 2019-20.
2.16 Future Policy Production: In terms of local policy, the focus for 2019-20 will be on supplementary planning documents. At the time of this report, drafts of the Design Guide for House Extensions SPD and Affordable Housing SPD had been produced, and both are expected to be adopted during 2020-21.
2.17 With the publication of the Planning White Paper in August 2020, there is considerable uncertainty around future planning policy production in the longer term. The Council will keep requirements under review, taking account of any transitional arrangements, in identifying timescales for future policy production.
2.18 In terms of the Minerals and Waste Local Plan, it is expected that the plan will be submitted during 2020-21, which will commence the examination process. Once examination starts, the timetable will no longer be in the hands of the local authorities.
2.19 Conclusions: Adoption of the Local Plan represents a highly significant milestone in policy progress, and allows the Council to focus on bringing a suite of supplementary planning documents into place. Progress on the Minerals and Waste Local Plan has now fallen some way behind the LDS, and this will have a knock-on effect on submission, examination and adoption.
3 Duty to co-operate
3.1 The Council is required to report on measures that have been undertaken to comply with the Duty to Co-operate, which is set out in the Localism Act 2011. Reading’s Local Plan was adopted in November 2019, and most of the duty to co-operate measures were undertaken earlier in the plan making process, in accordance with good practice. This means that there have been relatively few duty to co-operate measures undertaken in comparison to previous years. However, there are also ongoing joint arrangements with neighbouring authorities, as well as work that has been undertaken to inform plans of other authorities during 2019-20.
3.2 The Council has prepared a Duty to Co-operate Scoping Strategy (December 2015), which identifies those issues to address within the local plan that are likely to be strategic matters and which therefore fall under the duty to co-operate, and identifies the specified bodies with which co-operation may be necessary. It therefore provides context for carrying out the duty to co-operate.
3.3 Development Plans Group: The Council has long standing formal arrangements with the other five former Berkshire unitary authorities that deal with strategic planning issues. The Berkshire Heads of Planning has a strategic overview and the Development Plans Group (DPG) provides a co-ordinating role in respect of cross boundary issues. DPG comprises policy officers from the six Berkshire unitary authorities, and discusses planning policy matters of mutual interest. Whilst not therefore representing a duty to co-operate measure in itself, it nonetheless forms part of the overall duty to co-operate picture, and has a role in co-ordinating a number of actions under the duty, such as the joint preparation of evidence. The following meetings of DPG were held during 2019-20:
- 9th May 2019
- 9th July 2019
- 3rd September 2019
- 5th December 2019
- 11th February 2020
3.4 Grazeley: As reported in previous years, the Council has been co-operating with Wokingham Borough Council and West Berkshire District Council, with the support of Thames Valley Berkshire Local Enterprise Partnership, on a proposal for a new settlement of up to 15,000 homes at Grazeley, based on garden village principles. The Grazeley site straddles the boundary between Wokingham and West Berkshire, just south of Reading, and includes a small area of land within Reading. The Council’s support for this proposal is based on provision of the substantial infrastructure required in a timely manner.
3.5 A bid for capacity funding under the Garden Settlement Prospectus was submitted, and £750,000 was awarded in May 2019. A Housing Infrastructure Fund bid for forward funding of the necessary infrastructure was jointly developed and submitted in 20th March 2019.
3.6 A Grazeley Joint Delivery Board (GJDB) was established, and first met in September 2019. This comprises three Councillors from Wokingham, two from West Berkshire and one from Reading, and meets on a bi-monthly basis. At this stage, the GJDB operates mainly as a steering body, but has potential to develop into a body with some devolved powers, and an Expression of Interest was also submitted in February 2020 on behalf of the three authorities under the New Development Corporation Competition.
3.7 Other work that has got underway includes masterplanning for the Grazeley proposal, with potential to feed into to the production of a Supplementary Planning Document to inform and guide planning applications for the site. Work was also commissioned on developing a brand for Grazeley, including a website and engagement strategy.
3.8 It was announced as part of the Budget in March 2020 that the Grazeley HIF bid had not been successful, with one of the reasons being that the project did not need to rely on central funding to be delivered. The authorities are currently considering the way forward with the proposal, including whether alternative sources of funding are available.
3.9 Minerals and Waste Local Plan: The previous section has already outlined the progress made on the Minerals and Waste Local Plan, which is being prepared jointly by Bracknell Forest Borough Council, Royal Borough of Windsor and Maidenhead, Wokingham Borough Council, as well as Reading Borough Council. This involves significant amounts of co-operation and coordination between the four authorities. As part of this process, there have continued to be duty to co-operate discussions held with neighbouring minerals and waste planning authorities, but these will be reported separately in supporting the plan submission.
3.10 Other authorities’ plan making: With Reading’s Local Plan having already been submitted, much of the focus of duty to co-operate working has been on plan preparation with other authorities. As part of this, RBC has contributed to duty to co-operate discussions relating to the local plans of Bracknell Forest and Wokingham Borough Councils, as well as the new Oxfordshire 2050 plan being prepared by the Oxfordshire authorities.
3.11 Other measures: The table below lists the main actions relevant to the duty to co-operate that have been undertaken between 1 April 2019 and 31 March 2020.
Chronological list of Duty to Co-operate Measures 2019-20
| Date | Event |
|---|---|
| 12/04/2019 | RBC submits response to Oxfordshire Plan 2050 Call for Ideas |
| 25/04/2018 | Joint Central and Eastern Berkshire Minerals and Waste Local Plan officer group meeting, Wokingham |
| 09/05/2019 | DPG, Wokingham |
| 05/06/2019 | Joint Central and Eastern Berkshire Minerals and Waste Local Plan Members Sounding Board, Reading |
| 09/07/2019 | DPG, Reading |
| 03/09/2019 | DPG, Newbury |
| 13/09/2019 | Grazeley Joint Delivery Board, Wokingham (WBC, WBDC, RBC) |
| 13/09/2019 | Joint Central and Eastern Berkshire Minerals and Waste Local Plan officer group meeting, Bracknell |
| 18/09/2019 | Joint Central and Eastern Berkshire Minerals and Waste Local Plan Members Sounding Board, Reading |
| 19/09/2019 | Bracknell Local Plan duty to co-operate meeting, Bracknell |
| 24/09/2019 | Oxfordshire Plan 2050, duty to co-operate meeting, Green Park (OCC, SODC, WBC, RBC, TVB LEP) |
| 25/10/2019 | Grazeley Joint Delivery Board, Wokingham (WBC, WBDC, RBC) |
| 13/11/2019 | Wokingham Local Plan Update, Grazeley policy meeting, Wokingham (WBC, WBDC, RBC) |
| 26/11/2019 | Joint Central and Eastern Berkshire Minerals and Waste Local Plan officer group meeting, Maidenhead |
| 04/12/2019 | Joint Central and Eastern Berkshire Minerals and Waste Local Plan Members Sounding Board, Reading |
| 05/12/2019 | DPG, Bracknell |
| 10/01/2020 | Grazeley Joint Delivery Board, Wokingham (WBC, WBDC, RBC) |
| 27/01/2020 | Letter received from Elmbridge Borough Council enquiring about capacity to meet unmet housing need |
| 31/01/2020 | Response to Elmbridge Borough Council confirming no capacity to meet unmet need |
| 03/02/2020 | RBC consulted on WBC Draft Local Plan Update |
| 11/02/2020 | DPG, Slough |
| 06/03/2020 | Meeting with WBC and WBDC to set up a Grazeley Masterplan SPD |
ABBREVIATIONS: Basingstoke and Deane Borough Council (BDBC); Berkshire Local Nature Partnership (BLNP), Bracknell Forest Borough Council (BFBC), Buckinghamshire County Council (BCC), Chiltern and South Bucks District Councils (C&SBDC), Civil Aviation Authority (CAA), Environment Agency (EA), Hampshire County Council (HCC), Hart District Council (BDC), Highways England (HigE), Historic England (HisE), Homes and Communities Agency (HCA), Marine Management Organisation (MMO), Mayor of London (MoL), Natural England (NE), NHS England (NHS), NHS North and West Reading Clinical Commissioning Group (NWRCCG), NHS South Reading Clinical Commissioning Group (SRCCG), Office of Rail Regulation (ORR), Oxfordshire County Council (OCC), Royal Borough of Windsor and Maidenhead (RBWM), Rushmoor Borough Council (RuBC), Slough Borough Council (SBC), South Oxfordshire District Council (SODC), Surrey County Council (SCC), Surrey Heath Borough Council (SHBC), Swindon Borough Council (SwBC), Test Valley District Council (TVDC), Thames Valley Berkshire Local Enterprise Partnership (TVBLEP), Vale of White Horse District Council (VoWHDC), West Berkshire District Council (WBDC), Wiltshire Council (WC), Wokingham Borough Council (WBC), Wycombe District Council (WDC)
4 Local Plan monitoring
4.1 As set out in Section 2, the Council adopted the new Reading Borough Local Plan on 4th November 2019. Section 11 of the Local Plan is the monitoring section of the plan, and this includes a number of indicators with associated targets which should be used to assess the success of the policies.
4.2 The baseline figures for each indicator before the adoption of the plan were set out in 2018-19, and this AMR reports on the first year in which the policies are being applied (albeit only for part of the year). Appendix IV includes the table of the Local Plan monitoring indicators, and sets out the most recent information, which usually covers the 2019-20 year. Where relevant, it also includes any cumulative figures for the Local Plan period so far, as the base date for the plan is 1st April 2013. Appendix IV shows whether Local Plan monitoring targets have been met in 2019-20, although it should be noted that, as the plan was only adopted part-way through the monitoring year and was not therefore always used for planning decisions, not meeting those targets does not amount to a plan failure. However, it represents a useful measure at this point, particularly for comparison with future years.
4.3 Future versions of the AMR will include this table and update it with the most recent information so that there is an ongoing, easy-to-use guide to the success of the policies.
5 Sustainable development
Key Policies (at end of monitoring year):
- CC2: Sustainable Design and Construction
- CC3: Adaptation to Climate Change
- CC4: Decentralised Energy
- H5: Housing Standards
5.1 The Core Strategy places sustainable development at the heart of its agenda, in particular sustainable design and construction measures in policies CC2 and H5, with the latter seeking very ambitious standards in new housing. It is important that sustainable design and construction techniques are incorporated within development schemes in order to minimise their impact upon the environment. Policy CC3 focusses on the incorporation of appropriate measures to adapt to climate change, and Policy CC4 on securing energy for a development from a decentralised energy source.
5.2 Reading Borough Council declared a climate emergency in February 2019, and a Reading Climate Emergency Strategy was in production during the monitoring year. There is therefore a strong emphasis on sustainability across all of the Council’s functions.
Indicator 1: Sustainability requirements attached to major planning applications approved in 2019-20
- Number of major applications permitted = 17
- Number with condition requiring sustainability standard = 9
- Number without condition requiring sustainability standard = 8
5.3 Of the 17 major planning applications that were permitted during the monitoring year, 9 had conditions relating to sustainability.
5.4 The remaining 8 applications are related to applications for:
- Reserved matters (2)
- Temporary change of use of land (1)
- Change of use of building (2)
- Conversion of HMO to flats (1)
- Landscaping works (1)
- Erection of fence (1)
5.5 Although policy CC2 does apply to all development including refurbishments, changes of use and conversions, each case would need to be considered on its merits and the level of alteration to the fabric of the building taken into account.
5.6 For the reserved matters applications, conditions related to sustainability tended to have been set out in the earlier outline approval. Changes to land that do not include buildings, which applies to three major applications this year, will not be subject to CC2 or H5.
5.7 Policies in the new Local Plan seek more ambitious sustainability standards for major developments than their predecessors. However, as this was only adopted in November of the monitoring year, it has only applied to some of the permissions granted. The following sections deal with the specific standards achieved.
Indicator 2: Major new-build residential developments permitted at zero carbon homes standards in 2019-20
- Number of major residential new build applications permitted = 5
- Number at zero carbon homes standard = 0
- Proportion at zero carbon homes standard = 0%
5.8 Only five major residential new-build applications were approved in 2019-20, and none were at zero carbon standards. Two of these applications were permitted before the adoption of the new Local Plan policy. The remaining three were permitted by Planning Applications Committee subject to section 106 agreement prior to the new Local Plan coming into force, with the Section 106 agreement being signed afterwards. As such, the policy had not yet been used to determine any permitted applications at the end of the monitoring year.
Indicator 3: Major new-build non-residential developments permitted at BREEAM Excellent standards in 2019-20
- Number of major non-residential new build applications permitted = 6
- Number at BREEAM Excellent standard = 1
- Proportion at BREEAM Excellent standard = 17%
Only six major non-residential new-build applications were approved in 2019-20. One of these was permitted at BREEAM Excellent standards. Three of the applications were permitted prior to the adoption of the new Local Plan, and the previous policy was that developments should be 50% Very Good and 50% Excellent. Of the three applications permitted after adoption, two were permitted by Planning Applications Committee subject to section 106 agreement prior to the new Local Plan coming into force, and these are two of the same applications referred to in paragraph 5.7, as they were for a mix of uses.
6 Infrastructure contributions
Key Policies (at end of monitoring year):
- CC9: Securing Infrastructure
Main purpose of policies:
- Provide infrastructure to support development in the area
6.1 The Council has long been successful in securing developer contributions through S106 planning obligations. On 1 April 2015, the Council introduced the Community Infrastructure Levy, which replaces Section 106 for tariff-style contributions to strategic infrastructure. Section 106 continues to apply for affordable housing, employment and skills measures, and more site-specific infrastructure. Policy CC9 of the Local Plan sets the infrastructure priorities for new development.
6.2 The Council is required to produce an Infrastructure Funding Statement (IFS) annually by 31st December, in line with amended CIL Regulations that came into force in September 2019. The IFS reports on collection, allocation and spend of money during the financial year from both CIL and Section 106 agreements. It also sets out priorities for future spend. The Council’s first IFS was published in December 2020, and there is therefore no longer a need for the AMR to report on these matters in detail. However, for ease of reference, the summary information from the IFS is set out below.
Community Infrastructure Levy
- The total CIL collected by Reading Borough Council in 2019-2020 was £8.979 million
- The total CIL allocated in 2019-2020 was £1.586 million
- The total CIL spent in 2019-2020 was £1.753 million
- CIL liability notices were issued in 2019-2020 for £30.624 million
Section 106
- The total of financial contributions under Section 106 collected by Reading Borough in 2019-2020 was £3.510 million
- The total of financial contributions under Section 106 allocated in 2019-2020 was £2.527 million
- The total of financial contributions under Section 106 spent in 2019-2020 was £1.739 million
- Financial contributions were agreed in Section 106 agreements signed in 2019-2020 for a total of £9.426 million
7 Economic development and employment
Key Policies (at end of monitoring year):
- EM1: Provision of Employment
- EM2: Location of New Employment Development
- EM3: Loss of Employment Land
- EM4: Maintaining a Variety of Premises
Main purpose of policies:
- Direct major office development to central Reading and the A33 corridor
- Direct major employment development other than offices to the A33 corridor and Core Employment Areas
- Protect employment land within Core Employment Areas
- Maintain a range of floorspace, including small units, and B8 floorspace in the South of Basingstoke Road
Indicator 4: Amount of land completed and permitted for employment by type during 2019-2020 – Net
| Total Floorspace (m2) – Completed 2019-20 (Net) | B1 | B2 | B8 | Total |
|---|---|---|---|---|
| Central Reading | 1,580 | 0 | 0 | 1,580 |
| A33 Corridor | 5,631 | 0 | -278 | 5,353 |
| Core Employment Areas (outside A33 Corridor) | 26 | 0 | -276 | -250 |
| Other locations | -3,217 | 0 | -145 | -3,362 |
| Reading Total | 4,020 | 0 | -699 | 3,321 |
| Total Floorspace (m2) – Newly permitted 2019-20 (Net) | B1 | B2 | B8 | Total |
|---|---|---|---|---|
| Central Reading | -10,658 | -1,087 | 0 | -11,745 |
| A33 Corridor | -3,304 | 0 | -1,092 | -4,396 |
| Core Employment Areas (outside A33 Corridor) | 0 | 0 | 0 | 0 |
| Other locations | -592 | 0 | -2,516 | 3,108 |
| Reading Total | -14,554 | -1,087 | -3,608 | -19,249 |
Source: Non-Residential Commitments 2019-2020, Reading Borough Council
7.1 In terms of completed developments, the most substantial change has involved new B1 developments in the A33 corridor. This derives from two developments, both of which are redevelopments of existing employment land, demolition of which had been counted in previous years. There has been a small net gain in B1 floorspace in central Reading, which has been possible this year as there has only been very limited completion of office to residential prior approval developments. There has been a small net loss of employment floorspace in Core Employment Areas outside the A33 corridor, due to one change of use to a dance studio, albeit that retained some employment floorspace.
7.2 New permissions would lead to a fairly significant loss of B1 office floorspace in Central Reading, which stems from a number of new prior approvals for office to residential. Office floorspace would also decline in the A33 corridor, due entirely to one permission to change an office to a police headquarters. New permissions would also see some loss of B8 floorspace within Core Employment Areas in the A33 corridor. In overall terms, new permissions would mean a loss of almost 20,000 sq m of employment floorspace, although existing outstanding permissions are for an overall much more substantial increase.
7.3 The long term trend has been for a reduction in B1/B2 floorspace, so that 2016/17 saw the lowest level in over 25 years. However, there have been year on year increases in overall B1/B2 floorspace since 2017, albeit not on a very significant scale. New permissions would lead to a loss in floorspace to residential, but there are also existing permissions for a significant gain in new build office floorspace. The level of B8 space has increased over recent years, and the 2018-19 figure was the highest level in our records (which go back three decades). There has been a small decline in B8 floorspace this year, but this is not significant.
7.4 Note that Indicator 4 is not directly comparable with 5 and 6. This is because, in order to calculate a percentage, gross figures have to be used to exclude losses for 5 and 6, whereas net figures were used for 4.
Indicator 5: Proportion of office development completed and permitted which is in the centre or A33 Corridor
| Total B1 Floorspace (m2) – Gross Internal Floor Space | Completed 2019/20 | Permitted 2019/20 |
|---|---|---|
| Central Reading | 21,767 | 2,748 |
| A33 Corridor | 12,313 | 1,403 |
| Total in Reading | 35,086 | 4,179 |
| % of total which is in centre/A33 corridor | 97% | 99% |
7.5 Virtually all new office floorspace completed or permitted has been either in the centre or in the A33 corridor, in accordance the objectives of policy EM2.
Indicator 6: Proportion of industrial/warehouse development completed and permitted which is in the A33 Corridor or Core Employment Areas
| Total B2-B8 Floorspace (m2)* – Gross Internal Floor space | Completed 2019/20 | Permitted 2019/20 |
|---|---|---|
| A33 Corridor | 6,198 | 190 |
| Core Employment Areas (outside A33 corridor) | 1,877 | 0 |
| Total in Reading | 8,075 | 190 |
| % of total which is in CEA/A33 corridor | 100% | 100% |
NB: Figures are for gross internal floor-space
Source: Non-Residential Commitments 2019-2020, Reading Borough Council 2020
7.6 All completed and newly permitted industrial and warehousing development has been in the A33 Corridor or Core Employment Areas, in line with policy EM2.
Indicator 7: Net change in small business units (industrial/warehousing units of less than 150 m2 completed and permitted
| Net change in small units (less than 150m2) | Completed 2019/20 | Permitted 2019/20 |
|---|---|---|
| Net change in number of small units | 0 | 0 |
| Net change in floorspace of small units (m2) | 0 | 0 |
NB: Figures are for gross internal floor-space
Source: Non-Residential Commitments 2019-2020, Reading Borough Council 2020
7.7 There have been no losses of small industrial or warehouse uses either completed or permitted during the monitoring year, in accordance with policy EM4.
Indicator 8: Net change in storage and distribution floorspace in the south of Basingstoke Road
| Net Change in B8 Floorspace (m2) in South of Basingstoke Road | Completed 2019/20 | Permitted 2019/20 |
|---|---|---|
| Net change | 0 | -709 |
No changes have taken place in storage and distribution floorspace in the south of Basingstoke Road. There have been two new permissions affecting B8 floorspace in the area, one being a small net gain, the other being the loss of part of a building for a leisure facility.
Conclusion – Are policies fulfilling their purpose?
- Direct major office development to central Reading and the A33 Corridor
Virtually all major office development completed and permitted is directed to central Reading and the A33 corridor.
- Direct major employment development other than offices to the A33 corridor and Core Employment Areas
All new development for industry or warehouses both completed and permitted is in the A33 corridor or Core Employment Areas.
- Protect employment land within Core Employment Areas
There has been an overall net gain of employment floorspace within CEAs, although this includes a small net loss of B8 floorspace New permissions would lead to a loss of B class employment floorspace within CEAs, although this is due to changes of use to other uses which are related to employment.
- Maintain a range of floorspace, including small units, and B8 floorspace in the South of Basingstoke Road
There has been no change in small business units. New permissions would potentially lead to a loss of B8 floorspace in the South of Basingstoke Road area.
8 Housing
Key Policies (at end of monitoring year):
- H1: Provision of Housing
- H2: Density and Mix
- H3: Affordable Housing
- H4: Build to Rent Schemes
- H5: Standards for New Housing
- H6: Accommodation for Vulnerable People
- H7: Protecting the Existing Housing Stock
- H8: Residential Conversions
- H9: House Extensions and Ancillary Accommodation
- H10: Private and Communal Outdoor Space
- H11: Development of Private Residential Gardens
- H12: Student Accommodation
- H13: Provision for Gypsies and Travellers
- H14: Suburban Renewal and Regeneration
Main strategic purpose of policies:
- Ensure a good supply of housing of 689 dwellings per annum 2013-2036
- Ensure a good supply of affordable housing
- Ensure a mix of housing in Reading including provision of family housing
- Ensure high standards for new homes
- Set out policy for sites for student accommodation and for gypsies and travellers
8.1 This section sets out figures relating to the provision of housing over the monitoring year. It incorporates the annual assessment of Five Year Housing Land Supply required by national policy, as well as the full housing trajectory on which that is based.
8.2 For the purposes of Indicators 10, 11 and 12, i.e. the Five Year Housing Land Supply and Housing Trajectory, the 2019-20 AMR uses the housing target in policy H1 of the Local Plan, as opposed to the local housing need figure that would be generated by use of the standard methodology, which is currently lower.
Indicator 9: New housing delivered
| Monitoring Year | Net completed additional dwellings |
|---|---|
| 2010/11 | 321 |
| 2011/12 | 312 |
| 2012/13 | 474 |
| 2013/14 | 361 |
| 2014/15 | 635 |
| 2015/16 | 751 |
| 2016/17 | 717 |
| 2017/18 | 700 |
| 2018/19 | 910 |
| 2019/20 | 521 |
Housing Completions 2010-2020
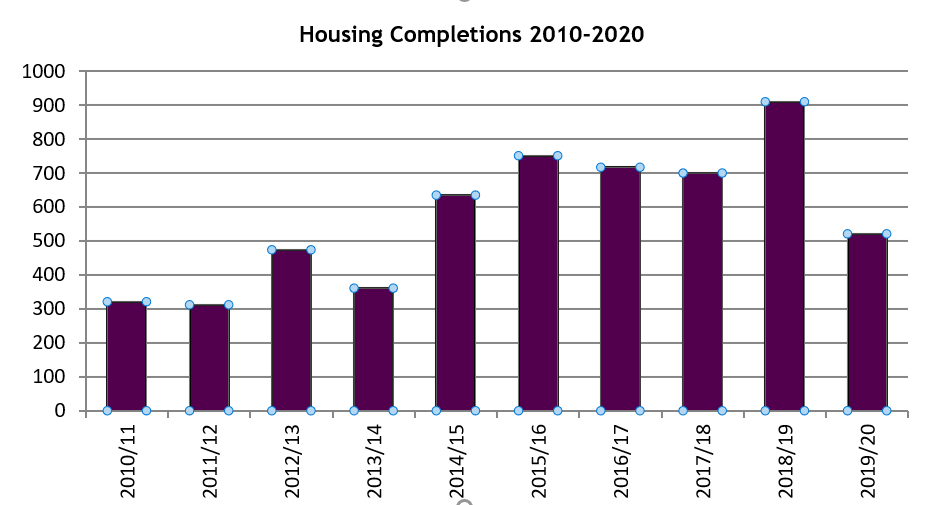
8.3 The number of completed dwellings this year was 521, the lowest since 2014, when the effects of the recession on housebuilding were still being felt. This is some way below the Local Plan annual target of 689, and is a significant drop from the 15-year high in 2018-19. It is thought that this is largely the result of natural fluctuation, with some large developments having completed in 2019, and large new developments that recently started not having yet delivered any homes as they comprise large flatted blocks and therefore will not deliver consistently across the years. There are not thought to have been significant impacts on completions from the response to Covid-19 in this year, as social distancing measures were introduced less than three weeks before the year ended. As in previous years, conversions and changes of use remain a strong element of supply, representing around 35% of this year’s completions. The contribution made by the town centre has been low this year, with only 61 completions in central Reading.
8.4 On the face of it, the number of dwellings under construction would point towards very healthy forthcoming levels of delivery, as the figure of 1,633 is a significant increase over last year’s 1,128, which was itself close to the highest level for decades. However, it remains to be seen how housebuilding levels will be affected by Covid-19 related measures or any subsequent economic impacts.
Indicator 10: Five Year Housing Land Supply (measured against Local Plan targets) including C3 dwellings only
Requirement
| Requirement | Total |
|---|---|
| Based on Local Plan 2013-2036 (policy H1) | 15,847 |
| Net Completions 2013-2019 | 4,074 |
| Net Completions 2019-2020 | 521 |
| Residual requirement 2020-2036 | 11,252 |
| Annual requirement for remaining 16 years, i.e. 11,252/16 | 703 |
| Annual requirement for remaining 16 years with 5% buffer (NPPF para 73) | 738 |
| Total requirement for 5 years 2020/21-2024/25, i.e. 738×5 | 3,692 |
Supply
| Supply | Total |
|---|---|
| Hard commitments (strategic sites, i.e. 10 dwellings+) to be delivered 2020-2025 | 3,882 |
| Soft commitments (strategic sites) subject to S106 to be delivered 2020-2025 | 405 |
| Local Plan allocations to be delivered 2020-2025 | 0 |
| Allowance for small site windfalls at 127 per annum | 635 |
| Total site-specific supply for 5 years 2020/21-2024/25 | 4,922 |
This represents a 6.67 years supply (i.e. 4,922/738).
Please see Appendix II for full tables of sites.
8.5 This version of the 5-year housing land supply deals only with dwellings within the C3 use class, so excludes consideration of other forms of housing such as student accommodation or residential care. These are included within the equivalent calculation under Indicator 11
8.6 The AMR assesses housing land supply against the policy targets of the new Local Plan. As can be seen above, Reading has a healthy 6.67 years’ supply against Local Plan housing targets.
8.7 Non-implementation rates are applied to sites which have not yet started in both the Five Year Supply and the Housing Trajectory. For sites with planning permission, this is usually 10% unless there is reason to believe otherwise. However, a 20% rate is applied to sites with prior approval for office to residential conversion. Because this is such a quick and cheap application route, some prior approvals are submitted fairly speculatively and will never be implemented. Our records show that, of prior approvals granted up to 31st March 2017, 82.4% were implemented (or replaced by an alternative residential conversion that was then implemented), whilst 17.6% expired and remained in office use. A 20% non-implementation rate is therefore applied to office prior approvals. For local plan allocations, either 10 or 20% is assumed depending on whether the owner confirmed availability in the most recent Housing and Economic Land Availability Assessment. The full version of the Housing Trajectory in Appendix III sets out the non-implementation rate that has been applied.
Indicator 11: Five Year Housing Land Supply (measured against Local Plan targets) including other forms of accommodation
8.8 This version of the 5-year housing land supply assessment factors in forms of residential accommodation that are not dwellings within the C3 use class. Planning Practice Guidance clarifies that housing provision should take account of housing for older people, which may be within the C2 residential institution use class. It also states that student accommodation can count towards the housing requirement on the basis that it frees up other housing. Our approach also takes account of houses in multiple occupation (which forms an important source of accommodation in Reading) and other residential institutions. The key is that these should only be included as part of the supply if they have also been factored into need, to ensure consistency.
Requirement
| Requirement | Total |
|---|---|
| Based on Local Plan policies H1, H6, H12 (2013-2036) | 16,224 |
| Net Completions 2013-2019 | 4,202 |
| Net Completions 2019-2020 | 545 |
| Residual requirement 2020-2036 | 11,477 |
| Annual requirement for remaining 16 years, i.e. 11,477/16 | 717 |
| Annual requirement for remaining 16 years with 5% buffer (NPPF para 73) | 753 |
| Total requirement for 5 years 2020/21-2024/25, i.e. 753×5 | 3,766 |
Supply
| Supply | Total |
|---|---|
| Hard commitments (strategic sites, i.e. 10 dwellings+) to be delivered 2020-2025 | 3,968 |
| Soft commitments (strategic sites) subject to S106 to be delivered 2020-2025 | 405 |
| Local Plan allocations to be delivered 2020-2025 | 0 |
| Allowance for small site windfalls at 127 per annum | 635 |
| Total site-specific supply for 5 years 2020/21-2024/25 | 5,008 |
This represents a 6.65 years supply (i.e. 5,008/753).
8.9 The different sources of housing have been dealt with as follows:
- Student accommodation
Our approach assumes that four student bedspaces equate to one dwelling. This is based on the fact that, where students occupy traditional housing, it tends to be terraced housing close to the University for 3-5 people.
The Statement of Common Ground signed between the Council and University of Reading recognises an existing need for first year accommodation of 1,000 bedspaces, and this is reflected in the Local Plan. It has been added to the need as an equivalent of 250 dwellings, on the basis of the assumption above.
- Houses in Multiple Occupation
The approach to HMOs is largely similar to that for student accommodation. Small C4 HMOs are already counted as ‘dwellings’ in our monitoring anyway. For larger ‘sui generis’ HMOs, it is considered that, where it is a cluster of bedrooms in a dwelling style with shared kitchen and living facilities, it is equivalent to a single dwelling. Where it is bedsits with shared toilet facilities, it is assumed that four bedsits equates to one dwelling. There is no additional need for HMOs identified in the SHMA or Local Plan.
- Residential care and other accommodation for older people
Some accommodation for older people, such as extra care housing, tends to count as a C3 dwelling anyway, where it is a wholly self-contained residential unit, and this section does not therefore apply in those cases.
Provision of residential care, or other specialist housing for older people also potentially frees up existing housing to help meet needs. However, it will not be the case that each residential care (or equivalent) space equates to one dwelling. A partner may stay living in the main home, for instance, or someone may move into care after living with family, either in the main home or in an annexe. The assumption has been made that entirely self-contained units free up one dwelling, whereas in care accommodation with shared facilities, two new residential care spaces free up one new home.
The SHMA has also identified a fairly limited need for new residential care on top of the overall housing need, of 253 bedspaces over the whole plan period, which Is identified in policy H6 of the Local Plan. Using the two to one ratio above, a need of 127 over the plan period is added to the overall housing requirement.
8.10 The resulting calculation is very similar to the supply when only C3 dwellings are included. A healthy supply of 6.65 years is identified.
8.11 The Council’s view is that, because this is the most comprehensive assessment of residential accommodation supply, it is Indicator 11 which is Reading’s official figure for 5-year housing land supply.
Indicator 12: Housing trajectory against Local Plan targets
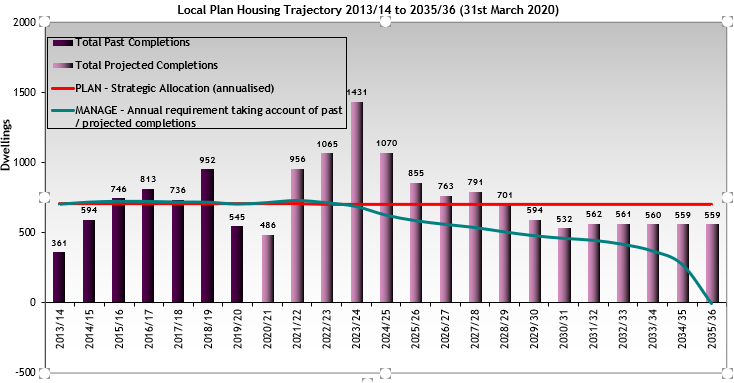
The full table of sites and figures is contained in Appendix III
8.12 As can be seen from the trajectory as measured against Local Plan targets, it is expected to slightly exceed the overall Local Plan housing targets by 2036. Over the Local Plan period, there will be some fluctuation in comparison to the Local Plan targets, as more information becomes known on sites, and as they start to come forward and deliver, or are used for other purposes.
8.13 For the avoidance of doubt, the housing trajectory includes forms of accommodation other than C3 dwellings, and so it is based on the same figures as in the 5-year housing land supply in Indicator 11.
Indicator 13: Affordable housing completions
| Rented (affordable/ social) (gross) | Shared ownership (gross) | Other affordable (gross) | Total (gross) | |
|---|---|---|---|---|
| Homes delivered 2019-20 | 80 | 0 | 0 | 80 |
8.14 The amount of affordable housing completed in 2019-20 is significantly less than in 2018-19 (158), although is still higher than the overall amounts in 2017-18 (66), 2016-17 (60) and 2015-16 (52). All of the delivery this year has been in the form of rented accommodation. In particular, the delivery of 45 new local authority homes (mainly at Conwy Close) has been the main contributor to supply. The main private development delivering affordable homes was 23 dwellings at Worton Grange, whilst a housing association development at St George’s Road delivered a further 12 homes. There are 403 affordable dwellings under construction, so the coming years should see good levels of delivery, albeit that it will still be some way short of the assessed annual need for new affordable housing of 406 from the SHMA.
8.15 It should be noted that this indicator relates to new dwellings completed, in line with the commitments monitoring, which is not necessarily the same point as when the dwelling is transferred to a registered provider or occupied, and for that reason the affordable housing delivery figures in this AMR may well differ from other affordable housing monitoring sources.
8.16 There are still constraints on the Council’s ability to secure affordable housing. Some developers have been able to demonstrate that full compliance with the Council’s policy is not viable. In addition, there continues to be significant use of the permitted development right to convert offices to residential (see Indicator 19). As no planning permission is required, these developments avoid the requirement to provide affordable housing.
8.17 There is a continued very substantial need to secure additional affordable housing – the results of the Berkshire Strategic Housing Market Assessment show that there is a need for 406 affordable dwellings per annum. At the same time, changes to the national planning system are making it more and more difficult to secure provision of affordable housing from new developments.
Indicator 14: Affordable housing secured
| Affordable housing contributions secured through Section 106 in 2019-20 | Sites of 1-4 dwellings | Sites of 5-9 dwellings | Sites of 10+ dwellings |
|---|---|---|---|
| Total homes permitted on sites subject to policy H3 | 69 | 55 | 896 |
| On-site affordable homes secured | 7 | 2 | 27 |
| Off-site financial contribution secured | £483,316.25 | £78,250.00 | £567,375.00 |
| Equivalent affordable dwellings secured on-site and off-site | 11.8 | 2.8 | 32.7 |
| Overall contribution as a proportion | 17.1% | 5.1% | 3.6% |
8.18 Policy H3 of the Local Plan sets expectations for how much affordable housing will be secured as part of a planning permission, and these expectations differ according to the scale of site. This indicator considers the degree to which those proportions are achieved in planning permissions granted during the year.
8.19 A number of types of development do not result in a Section 106 agreement, and there are not therefore opportunities to secure affordable housing. This includes prior approvals and certificates of lawfulness. The policy also excludes replacement of a single dwelling with another single dwelling and conversion of a dwelling to self-contained flats where there is no new floorspace. These are not therefore included in the total homes permitted.
8.20 Since there is often a mix of on-site units and off-site financial contributions, there needs to be a way of converting this to a consistent measure which can be calculated as a percentage. Background information to the Local Plan estimated that a developer contribution of £100,000 was required to deliver one affordable unit, on the basis of an overall cost of £200,000, but with the Council then using the contribution to subsidise part of the build and borrow for the remaining costs. If a property were to be let at target rent, this would mean subsidising 50% of the build, so £100,000 is required. On individual sites, policy compliance can only be assessed on the basis of the Gross Development Value of the development, but the above represents a useful shorthand.
8.21 On sites of 1-4 dwellings, the policy requirement of 10% has been exceeded, with this being boosted by some small developments for 100% affordable as part of the Local Authority New Build programme. However, the affordable housing achieved on sites of 5-9 and 10 or more dwellings has fallen very significantly short of the respective policy requirements of 20% and 30%. This is the result of applicants being able to demonstrate a viability case for a lower contribution. The new Local Plan policy was only adopted part way through the monitoring year, so the effects of the new policy, which will also be applied in tandem with new NPPF wording, will need to be closely monitored.
Indicator 15: Dwellings completed and permitted during 2019-20 by size and type
Dwellings completed (net change) during 2019-20 by size and type
| Size | Flats | Houses | Total | % of total |
|---|---|---|---|---|
| 1-bed/studio | 238 | 2 | 240 | 46.1 |
| 2-bed | 187 | 13 | 200 | 38.4 |
| 3-bed | 12 | 60 | 72 | 13.8 |
| 4-bed | 0 | 15 | 15 | 2.9 |
| 5+ bed | 0 | -5 | -5 | -1.0 |
| Total | 437 | 84 | 521 | |
| % of total | 83.9 | 16.1 |
Dwellings permitted (net change) during 2019-20 by size and type*
| Size | Flats | Houses | Total | % of total |
|---|---|---|---|---|
| 1-bed | 335 | 1 | 336 | 78.9 |
| 2-bed | 69 | 7 | 76 | 17.8 |
| 3-bed | 3 | 17 | 20 | 4.7 |
| 4-bed | 0 | 3 | 3 | 0.7 |
| 5+ bed | 0 | -9 | -9 | -2.1 |
| Total | 407 | 19 | 426 | |
| % of total | 95.5 | 4.5 |
*The uplift of 63 dwellings in the new Plot E permission for Station Hill has been excluded from these figures, because the new permissions this year are reserved matters, whereas previously outline permissions were counted where unit mix was not known.
8.22 This indicator measures the overall proportion of the net change in dwellings which are flats or houses and the number of bedrooms. It includes development from all sources, including conversions and changes of use, which tend to provide smaller accommodation.
8.23 In terms of completions, almost 85% of dwellings were for one- or two-bed, and a similar proportion were for flats rather than houses. The large majority of new accommodation therefore continues to be small and flatted, even though completions in central Reading were considerably lower than in recent years.
8.24 Almost all new permissions were for flats, and virtually all new permissions were for one or two bed dwellings. This is in line with the figures for 2017-18 and 2018-19 and shows that proposals continue to be dominated by smaller accommodation. This year, most of the largest new permissions are for office to residential prior approvals, which are dominated by studios and 1-bed dwellings.
Indicator 16: New build dwellings completed and permitted during 2019-20 by size and type
New build dwellings completed (net change) during 2019-20 by size and type
| Size | Flats | Houses | Total | % of total |
|---|---|---|---|---|
| 1-bed/studio | 87 | 3 | 90 | 26.4 |
| 2-bed | 140 | 14 | 154 | 45.2 |
| 3-bed | 2 | 68 | 70 | 20.5 |
| 4-bed | 0 | 21 | 21 | 6.2 |
| 5+ bed | 0 | 6 | 6 | 1.8 |
| Total | 229 | 112 | 341 | |
| % of total | 67.2 | 32.8 |
New build dwellings permitted (net change) during 2019-20 by size and type
| Size | Flats | Houses | Total | % of total |
|---|---|---|---|---|
| 1-bed | 28 | 1 | 29 | 28.4 |
| 2-bed | 27 | 10 | 37 | 36.6 |
| 3-bed | 0 | 24 | 24 | 23.8 |
| 4-bed | 0 | 11 | 11 | 10.9 |
| 5+ bed | 0 | 0 | 0 | 0 |
| Total | 55 | 46 | 101 | |
| % of total | 54.5 | 45.5 |
8.25 This section deals with new build dwellings only, for the reason that the Council’s housing mix policies refer only to new build dwellings. This is therefore more meaningful in evaluating the effectiveness of the Council’s policies.
8.26 In terms of new build completions, 28.4% of the total is for three-bed or more. This is some way below the policy target of 50%. When dwellings in designated centres are excluded, to consider compliance with policy H5, the figure barely changes, at 28.9%. Some completions were on sites that predated this policy position, with 88 1- and 2-bed flats completed this year on a site outside a centre that was granted permission on appeal in 2007, but nevertheless, this should be carefully monitored.
8.27 The mix of dwellings in new permissions for new-build is more balanced than in recent years, although still less than a third is for dwellings with three or more bedrooms. When the indicator is narrowed down to new build housing developments outside centres, which are the developments to which the main housing mix policy applies, there is more of a balance again, with 42.6% of newly permitted new build dwellings being for three or more bedrooms. However, the overall numbers are small, because most of the new permissions are not for new-build. This therefore emphasises the continued importance of securing larger family homes in future developments.
Indicator 17: New dwellings on previously developed land
- Net Completions – 521
- Net Completions on previously developed land – 456
- % of completions on previously developed land – 88%
8.28 The vast majority of new development in Reading continues to take place on previously-developed land, unsurprisingly given the character of the Borough. Most of the remaining 12% of dwellings are being delivered at Green Park Village, Reading’s only large greenfield development of recent years.
Indicator 18: Net additional gypsy and traveller pitches
8.29 No net additional gypsy and traveller pitches have been brought forward in Reading Borough in 2018-19. A Gypsy and Traveller Accommodation Assessment was commissioned in November 2016 to assess the need for new pitches. This reported in September 2017, and identified a need for new permanent and transit pitches, which subsequently led to a consultation on potential sites, but the Council has not been able to identify appropriate sites to accommodate this need, and no sites have been included in the Local Plan. There have also been no planning applications made for pitches.
Indicator 19: Office to residential prior approvals
| Completed 2019-20 | Underway at 31/03/20 | Newly permitted 2019-20 | Permitted (not started) at 31/03/20 | |
|---|---|---|---|---|
| Number of prior approvals | 6 | 8 | 7 | 22 |
| Amount of office floorspace lost (m2) | 3,716 | 5,658 | 12,212 | 27,486 |
| Amount of dwellings gained | 102 | 108 | 259 | 499 |
8.30 This measure monitors the take-up of the permitted development right introduced in 2013 to allow offices to convert to residential. It can be seen that there continues to be significant use of this right in Reading. The completed developments represent 19% of overall housing supply this year, which is slightly lower than the 21% in 2018-19 and significantly lower than the peak of 40% of supply in 2016-17. The amount of development underway shows that similar levels are expected in the coming year, but the number of new proposals this year (which make up 53% of all new permitted dwellings) demonstrate that office to residential prior approvals will continue to be a feature of development in the Borough. The majority of prior approvals continue to be within the town centre, but office buildings in South Reading in particular are increasingly now featuring.
8.31 Also of note is the amount of office floorspace that Reading has lost and stands to lose as a result of this permitted development right, with around 33,000 sq m of floorspace either in the process of conversion or with prior approval to convert.
Indicator 20: Other forms of residential (residential care, HMOs and student accommodation)
| Net change | Completed 2019-20 | Newly permitted 2019-20 | Under construction 31/03/20 | Not started 31/03/20 |
|---|---|---|---|---|
| Residential care bedspaces | 4 | 2 | -6 | 171 |
| HMO (sui generis) bedspaces | 79 | 52 | 27 | -14 |
| Student bedspaces | 15 | 27 | 225 | 56 |
| Estimated dwelling equivalent (see below for how calculated) | 24 | 49 | 205 | 126 |
8.32 There are various other forms of residential which do not count as ‘dwellinghouses’ within use class C3 and are not therefore included in dwelling completion figures. This includes residential care within the C2 use class, and large houses in multiple occupation (with more than 6 people) and dedicated student accommodation, both of which tend to count as ‘sui generis’, so within their own use class. Some retirement apartments for older people fall within the C3 use class and are counted within the overall dwelling figures, and are not included here. Similarly, small HMOs within the C4 use class (between three and six people) are included within the dwelling figures and not counted here.
8.33 The Berkshire Strategic Housing Market Assessment considered the need for new residential care bedspaces (within the C2 use class) alongside more general housing requirements. It identified a need for 253 bedspaces within Reading up to 2036, which policy H7 of the new Local Plan aims to provide. This is a reasonably modest total. There was a net gain of only 4 new bedspaces delivered this year. In total, a net loss of 58 residential care bedspaces has been recorded over the period of the new Local Plan so far (i.e. between 2013 and 2020).
8.34 There is no identified need for large HMOs. There was a sizeable gain of HMO bedspaces this year, generally through changes of use of large dwellings to HMOs.
8.35 There is known to be a need for new student accommodation, and the University of Reading currently has difficulties in meeting its guarantee of University accommodation for new students who listed the University as their preferred choice. At the moment, the shortfall in meeting this guarantee is in the region of 1,000 spaces. There have only been 15 bedspaces completed this year, which were at Hillside on Allcroft Road. In total, there has been a net gain of 797 student bedspaces in the plan period, between 2013 and 2020.
8.36 Planning Practice Guidance clarifies that overall housing provision should take account of housing for older people, which may be within the C2 residential institution use class. It also states that student accommodation can count towards the housing requirement on the basis that it frees up other housing. Therefore, there is a need to convert these other forms of accommodation to an equivalent number of residential units to include within the housing trajectory and housing land supply. Our approach also takes account of houses in multiple occupation (which forms an important source of accommodation in Reading) and other residential institutions. The key is that these should only be included as part of the supply if they have also been factored into need, to ensure consistency.
8.37 The different sources of housing have been dealt with as follows:
- Student accommodation
Our approach assumes that four student bedspaces equate to one dwelling. This is based on the fact that, where students occupy traditional housing, it tends to be terraced housing close to the University for 3-5 people.
The Statement of Common Ground signed between the Council and University of Reading recognises an existing need for first year accommodation of 1,000 bedspaces, and this is reflected in the Local Plan. It has been added to the need within the housing land supply calculations (see Indicator 11) as an equivalent of 250 dwellings, on the basis of the assumption above.
- Houses in Multiple Occupation
The approach to HMOs is largely similar to that for student accommodation. Small C4 HMOs are already counted as ‘dwellings’ in our monitoring anyway. For larger ‘sui generis’ HMOs, it is considered that, where it is a cluster of bedrooms in a dwelling style with shared kitchen and living facilities, it is equivalent to a single dwelling. Where it is bedsits with shared toilet facilities, it is assumed that four bedsits equates to one dwelling. There is no additional need for HMOs identified in the SHMA or Local Plan, and it forms part of general housing need.
- Residential care and other accommodation for older people
Some accommodation for older people, such as extra care housing, tends to count as a C3 dwelling anyway, where it is a wholly self-contained residential unit, and this section does not therefore apply in those cases.
Provision of residential care, or other specialist housing for older people also potentially frees up existing housing to help meet needs. However, it will not be the case that each residential care (or equivalent) space equates to one dwelling. A partner may stay living in the main home, for instance, or someone may move into care after living with family, either in the main home or in an annexe. The assumption has been made that entirely self-contained units free up one dwelling, whereas in care accommodation with shared facilities, two new residential care spaces free up one new home.
The SHMA has also identified a fairly limited need for new residential care on top of the overall housing need, of 253 bedspaces over the whole plan period, which Is identified in policy H6 of the Local Plan. Using the two to one ratio above, a need of 127 over the plan period is added to the overall housing requirement within indicators 11 and 12.
8.38 On the basis of the above methodologies, a residential equivalent of 24 dwellings has been completed this year and can be added to the dwelling completions of 521 for the purposes of the housing trajectory and housing land supply calculations.
Indicator 21: Self and custom-build
8.39 The Council has a statutory duty to grant permission to enough serviced plots for self and custom-housebuilding to meet the need in the relevant base period. Base periods run from 31st October in one year to 30th October the following year, with the first base period being 31st October 2015 to 30th October 2016. Authorities have three years to grant sufficient permissions, which means that the relevant periods for this report are the first base period (31st October 2015 to 30th October 2016), for which sufficient permissions should have been granted by 30th October 2019, and the second base period (31st October 2016 to 30th October 2017).
8.40 Planning permissions in Reading do not generally specify whether a development is self-build. There could be an exception to this where plots are set aside as part of a larger development, but this has not yet happened in Reading. Therefore, the only way in which the Council can monitor its statutory duty is through the granting of self-build relief from the Community Infrastructure Levy. As can be seen from the table below, the number of dwellings granted self-build relief is less than the need for the relevant base period. This is unsurprising given that a policy to secure self-build housing on larger developments was only adopted in November 2019, and that the mostly flatted development in Reading does not lend itself to self-build.
| Date of entries on self-build register | Number of entries | Date permission granted | Number of homes granted permission* | Duty met? |
|---|---|---|---|---|
| First base period (31/10/15-30/10/16) | 41 | Permissions granted by 30/10/19 | 28 | No |
| Second base period (31/10/16-30/10/17) | 112 | Permissions granted by 30/10/20 | 34 | No |
| Third base period (31/10/17-30/10/18) | 158 | Permissions granted by 30/10/21 | TBC | N/A |
| Fourth base period (31/10/18-30/10/19) (Part 1) | 13 | Permissions granted by 30/10/22 | TBC | N/A |
* Permissions granted generally measured by grant of CIL self-build relief
8.41 At the beginning of this monitoring year, on 1st April 2019, the Council introduced a test of sufficient resources, and a local connection test. As a result, the Self Build Register has been divided into a Part 1 and Part 2. Part 1 contains those who have demonstrated a local connection, and it is the number of entries on Part 1 which will be considered in exercising the statutory duty. This has had the effect of significantly reducing the scale of demand on the register, and this will be likely to affect whether the authority complies with the duty in future years. At 31st October 2019, there were 13 entries on Part 1 and 7 entries on Part 2.
8.42At the same time, a new policy on securing self-build has been introduced as part of the Local Plan, which in the long term should help bring supply more into line with demand.
Conclusion – Are policies fulfilling their purpose?
- Ensure a good supply of housing, with an objectively assessed need of 699 per annum from 2013-2036, and a target in the new Local Plan of 689 per annum
Housing delivery has fallen substantially this year, after the very high levels in 2018-19, and is below Local Plan targets this year. This is not expected to be a long-term trend and is most likely to be due to some large sites finishing delivery and some other large sites not yet being at the point where substantial numbers of dwellings are being completed. The number of dwellings under construction is currently very high. Covid-19 is not thought to have had any particular impact on 2019-20 figures, as it will primarily affect 2020-21.
- Ensure a good supply of affordable housing
The amount of affordable housing completed in 2019-20 is significantly less than in 2018-19, although is still higher than the overall annual amounts in 2015-18. The majority of new affordable homes were delivered through the Local Authority New Build programme.
- Ensure a mix of housing in Reading, and avoid dominance by small units and flats
In terms of both new permissions and new completions, small (1 and 2-bed) flats represent most of the new supply this year. In part this is due to the reliance on central Reading, which is not subject to the same dwelling mix policies. However, it also reflects dwellings delivered by permitted development rights where the Council has no control over size and type.
- Direct housing towards previously-developed land where possible
The vast majority of residential development continues to take place on previously-developed land.
- Set out policy for sites for gypsies and travellers
A need for 10-17 permanent pitches and 5 transit pitches for gypsies and travellers has been identified, but no additional pitches have been provided or identified in the new Local Plan. The Council is currently considering the way forward in terms of meeting the pressing transit needs.
9 Retail, leisure and culture
Key Policies (at end of monitoring year):
- RL1: Network and Hierarchy of Centres
- RL2: Scale and Location of Retail, Leisure and Culture Development
- RL3: Vitality and Viability of Smaller Centres
- RL4: Betting Shops and Payday Loan Companies
- RL5: Impact of Main Town Centre Uses
- RL6: Protection of Leisure Facilities and Public Houses
Main strategic purpose of policies:
- Direct retail, leisure and culture development to existing centres
- Preserve the network and hierarchy of centres
- Manage the mix of uses within smaller centres to ensure a strong retail presence and prevent domination by takeaways
Indicator 22: Proportion of retail and leisure floorspace permitted during 2019-20 that is in a designated centre
| Floorspace Permitted (m2 gross) | A1 | A2 | A3 | A4 | A5 | C1 | D2 | Total |
|---|---|---|---|---|---|---|---|---|
| Total in Centres | 447 | 295 | 1,185 | 436 | 155 | 10,350 | 600 | 13,468 |
| Total in Reading | 447 | 295 | 2,067 | 436 | 155 | 10,350 | 4,725 | 18,475 |
| % of total in centres | 100% | 100% | 57% | 100% | 100% | 100% | 13% | 73% |
Indicator 23: Proportion of retail and leisure floorspace completed during 2019-20 that is in a designated centre
| Floorspace Completed (m2 gross) | A1 | A2 | A3 | A4 | A5 | C1 | D2 | Total |
|---|---|---|---|---|---|---|---|---|
| Total in Centres | 0 | 160 | 415 | 436 | 0 | 1,014 | 216 | 2,241 |
| Total in Reading | 0 | 160 | 1,297 | 436 | 0 | 1,014 | 468 | 3,375 |
| % of total in centres | N/A | 100% | 32% | 100% | N/A | 100% | 46% | 66% |
9.1 The majority of both completions and new permissions are within designated centres this year. Around two thirds of completions are within designated centres, although the overall level of total completions is reasonably low. The most significant out-of-centre completion this year has been for a change of use within the Worton Grange development, which, although not within a centre, was allocated for some town centre uses in the previous development plan. Almost three-quarters of new permissions are within a centre, with D2 leisure uses the least likely to be within a centre. This included a change of use of a retail unit to a gym at Worton Grange (see above). The policy approach does not rule out development outside centres, as long as a sequential approach can be followed, so this does not mean that policy is not working.
9.2 Note that Indicators 22 and 23 are not directly comparable with 24 and 25. This is because, in order to calculate a percentage, gross figures have to be used to exclude losses for 22 and 23, whereas net figures were used for 24 and 25.
Indicator 24: Amount of retail and leisure floorspace permitted during 2019-20
| New Floorspace Permitted (m2 net) | A1 | A2 | A3 | A4 | A5 | C1 | D2 | Total |
|---|---|---|---|---|---|---|---|---|
| Central Reading | -1,761 | -749 | -32 | 105 | -467 | 10,184 | 311 | 7,591 |
| Basingstoke Road North | -103 | 0 | 0 | 0 | 103 | 0 | 0 | 0 |
| Caversham | -122 | 61 | 0 | 0 | 0 | 0 | -116 | -177 |
| Cemetery Junction | 0 | 0 | -465 | 0 | 0 | 0 | 0 | -465 |
| Christchurch Road | -135 | 0 | 135 | 0 | 0 | 0 | 0 | 0 |
| Wokingham Road | -258 | 0 | 258 | 0 | 0 | 0 | 0 | 0 |
| Total in Centres | -2,379 | -688 | -104 | 105 | -364 | 10,184 | 195 | 6,949 |
| Total in Reading | -5,026 | -688 | 778 | 105 | -264 | 10,184 | 4,320 | 9,409 |
Indicator 25: Amount of retail and leisure floorspace completed during 2019-20
| New Floorspace Completed (m2 net) | A1 | A2 | A3 | A4 | A5 | C1 | D2 | Total |
|---|---|---|---|---|---|---|---|---|
| Central Reading | -8,043 | -2,280 | -255 | 436 | 0 | 848 | 216 | -9,078 |
| Caversham | -122 | 61 | 0 | 0 | 0 | 0 | 0 | -61 |
| Cemetery Junction | 0 | 0 | -465 | 0 | 0 | 0 | 0 | -465 |
| Total in Centres | -8,165 | -2,219 | -720 | 436 | 0 | 848 | 216 | -9,604 |
| Total in Reading | -9.064 | -2,219 | 162 | 436 | 0 | 848 | 468 | -9,369 |
Source: Non-Residential Commitments 2019-2020, Reading Borough Council 2020
NB: Figures are for gross internal floorspace
9.3 Completions for retail and leisure uses this year have mainly resulted in a net loss of floorspace, particularly in A1 floorspace in Central Reading. The biggest loss was demolition of two large retail warehouses at Kenavon Drive in advance of a primarily residential redevelopment. Development in smaller centres has been for small-scale changes of use.
9.4 In terms of new permissions, there would be a net loss of A1 retail in Central Reading, which is mostly the result of a number of smaller changes of use. The most significant amounts of floorspace are for town centre hotels, with new permissions at Station Road and Hosier Street having been granted this year.
Indicator 26: Proportion of Key Frontage in smaller centres in A1 and A5 use
| Centre | Last survey | %A1/A2 target | %A1/A2 actual | %A5 target | %A5 actual |
|---|---|---|---|---|---|
| Basingstoke Road North | 2020 | 50 | 59.6 | 30 | 15.7 |
| Caversham | 2020 | 60 | 68.8 | 30 | 2.6 |
| Cemetery Junction | 2020 | 60 | 64.1 | 30 | 14.0 |
| Christchurch Road | 2020 | 60 | 72.0 | 30 | 13.6 |
| Coronation Square | 2020 | 60 | 56.9 | 30 | 18.5 |
| Dee Park | 2020 | 50 | 64.1 | 30 | 0 |
| Emmer Green | 2020 | 50 | 57.9 | 30 | 20.1 |
| Erleigh Road | 2020 | 50 | 56.7 | 30 | 8.8 |
| The Meadway | 2020 | 50 | 43.9 | 30 | 11.9 |
| Northumberland Avenue North | 2020 | 50 | 58.3 | 30 | 24.1 |
| Oxford Road West | 2020 | 50 | 60.6 | 30 | 8.5 |
| Shinfield Road | 2020 | 50 | 49.9 | 30 | 29.6 |
| Tilehurst Triangle | 2020 | 60 | 75.8 | 30 | 8.2 |
| Wensley Road | 2020 | 60 | 80.7 | 30 | 19.3 |
| Whitley | 2020 | 60 | 68.3 | 30 | 17.8 |
| Whitley Street | 2020 | 40 | 50.7 | 30 | 17.8 |
| Whitley Wood | 2020 | 60 | 76.5 | 30 | 0 |
| Wokingham Road | 2020 | 50 | 63.6 | 30 | 18.5 |
9.5 The survey was undertaken in November and December 2020. There were only three centres where the proportion of A1 and A2 frontage in the designated key frontages fell below the policy target – Coronation Square, The Meadway and Shinfield Road. In the case of Shinfield Road, the proportion is only extremely marginally below the policy target. There are known issues with the Meadway centre, and the centre is allocated for redevelopment for a new district centre in the Local Plan.
9.6 In terms of the maximum proportions of A5 takeaways, there are no centres where the policy ceiling has been exceeded, but three centres (Emmer Green, Northumberland Avenue North and Shinfield Road) where it is being approached, and where proposals for new A5 uses should be particularly carefully considered.
9.7 In September 2020, fundamental changes to the Use Classes Order came into force which meant that the Council lost the ability to control changes of use between retail (was A1), financial and professional (A2), restaurants and cafes (A3), offices and light industrial (B1), medical and health facilities (part of D1) and indoor leisure (D2). This means that parts of the policy controlling uses in centres will no longer be possible to implement for future monitoring years. The Council will consider continuing to monitor under the old use classes, as this may give some insight into the consequences of these changes.
Indicator 27: Proportion of primary frontage in Central Reading in A1 and A2 use
| Centre | Last survey | %A1/A2 target | %A1/A2 actual |
|---|---|---|---|
| Broad Street (North and South) | 2020 | 50 | 86.4 |
| St Mary’s Butts (East and West) | 2020 | 50 | 31.1 |
| Oxford Road (North and South) | 2020 | 50 | 65.1 |
| West Street (East and West) | 2020 | 50 | 36.5 |
| Friar Street (North and South) | 2020 | 50 | 40.2 |
| Chain Street (East and West) | 2020 | 50 | 93.2 |
| Union Street (East and West) | 2020 | 50 | 87.3 |
| Queen Victoria Street (East and West) | 2020 | 50 | 65.0 |
| Cross Street (East and West) | 2020 | 50 | 85.7 |
| Market Place, Butter Market and High Street | 2020 | 50 | 59.2 |
| Duke Street (East and West) | 2020 | 50 | 50.7 |
| King Street and Kings Road (North and South) | 2020 | 50 | 57.6 |
| Station Road (East and West) | 2020 | 50 | 18.2 |
| Gun Street (South) | 2020 | 50 | 34.2 |
| Oracle Riverside (North and South) | 2020 | 50 | 20.4 |
| TOTAL | 53.8 |
9.8 The Local Plan in policy CR7 identifies primary frontages in Central Reading and seeks to resist changes of use that would reduce the proportion of each frontage in A1 or A2 use below 50%. These frontages were surveyed in November 2020, and the proportion in A1/A2 use is shown in the table. This includes vacant units if the last known use was A1 or A2. The proportion varies considerably across the town centre, from the most retail-focused parts of the centre such as Broad Street to areas with more of a focus on food and drink such as St Mary’s Butts and the Oracle Riverside.
9.9 As set out in paragraph 9.7, the changes to the use classes order mean that the operation of this part of policy CR7 is no longer possible. Nevertheless, it may be worth monitoring against the old use classes to understand the impact of any changes.
Indicator 28: Retail vacancy in centres
| Centre | Last survey | All shop units | Units vacant | % vacancy |
|---|---|---|---|---|
| Reading Centre | 2020 | 764 | 133 | 17.4 |
| Basingstoke Road North | 2020 | 16 | 1 | 6.3 |
| Caversham | 2020 | 121 | 11 | 9.2 |
| Cemetery Junction | 2020 | 46 | 2 | 4.3 |
| Christchurch Road | 2020 | 14 | 2 | 14.3 |
| Coronation Square | 2020 | 11 | 0 | 0.0 |
| Dee Park | 2020 | 3 | 0 | 0.0 |
| Emmer Green | 2020 | 19 | 0 | 0.0 |
| Erleigh Road | 2020 | 14 | 1 | 7.1 |
| The Meadway | 2020 | 26 | 5 | 19.2 |
| Northumberland Avenue North | 2020 | 8 | 0 | 0.0 |
| Oxford Road West | 2020 | 155 | 16 | 10.3 |
| Shinfield Road | 2020 | 29 | 1 | 3.4 |
| Tilehurst Triangle | 2020 | 69 | 4 | 5.8 |
| Wensley Road | 2020 | 4 | 0 | 0.0 |
| Whitley | 2020 | 29 | 3 | 10.3 |
| Whitley Street | 2020 | 37 | 3 | 8.1 |
| Whitley Wood | 2020 | 5 | 0 | 0.0 |
| Wokingham Road | 2020 | 50 | 5 | 10.0 |
9.10 The levels of vacancy shown are based on surveys at the end of 2020. In general, some level of vacancy is to be expected to allow for turnover in the market, but vacancy levels above 10% could be cause for concern. Clearly, 2020 has been a difficult year for retail, with the Covid-19 pandemic arriving at a time when many retailers were already in a precarious situation, and high levels of vacancy would be expected this year.
9.11 The town centre of Reading has the second highest level of vacancy of all centres surveyed, at 17.4%. There is no 2019 figure to compare this to, but it is clearly a very high level of vacancy. All units in the Bristol and West Arcade are vacant pending redevelopment, and other parts of the town centre where vacancy is particularly high are Kings Walk Shopping Centre, Station Road and Union Street.
9.12 The smaller centres generally have a lower level of vacancy than the town centre. The exception is the Meadway Centre, a centre with identified issues proposed for redevelopment in a Local Plan allocation and adopted development brief, albeit that vacancy has reduced since 2019. Other centres which exceed the 10% rule of thumb are Christchurch Road and, by a small margin, Oxford Road West, Whitley and Wokingham Road, and these are worth keeping under review. The majority of smaller centres have seen an increase in vacancy in 2020, although there have been some big reductions in all four of the centres identified as being of concern last year (the Meadway, Coronation Square, Christchurch Road and Erleigh Road). In a generally difficult context for retail, most of the smaller centres have relatively low vacancy levels.
Conclusion – Are policies fulfilling their purpose?
- Direct retail, leisure and culture development to existing centres
The majority of both completions and new permissions are within designated centres this year. Around two thirds of completions are within designated centres. Almost three-quarters of new permissions are within a centre.
- Preserve the network and hierarchy of centres
There have not been any developments of a scale or in a location that would disrupt the network and hierarchy of centres.
- Manage the mix of uses within smaller centres to ensure a strong retail presence and prevent domination by takeaways
A small number of centres are below the threshold for proportion of A1 or A2 uses in the new Local Plan, and need to be carefully monitored. No centres exceed the threshold for proportion of takeaways. Vacancy levels are generally good in most of the smaller centres, but particularly high in the centre of Reading.
10 Transport
Key Policies (at end of monitoring year):
- TR1: Achieving the Transport Strategy
- TR2: Major Transport Projects
- TR3: Access, Traffic and Highway Related Matters
- TR4: Cycle Routes and Facilities
- TR5: Car and Cycle Parking and Electric Vehicle Charging
10.1 The Council continues to secure developer contributions via the Community Infrastructure Levy and, for site specific matters, S106 planning obligations towards a range of transport measures and the delivery of Reading’s transport strategy. All planning applications requiring the submission of a Travel Plan included one or were a requirement through condition. The Council’s Parking Standards SPD (Adopted Oct 2011) continued to be used to assess the appropriate level of parking.
10.2 A new Reading Transport Strategy 2036 is in production, and a draft was produced for consultation in May 2020.
Indicator 29: Progress on Major Transport Schemes
10.3 There are a number of transport schemes, both major and minor, that are underway or are in preparation in the Borough. The Transport pages of the Council’s website include information on the projects. In addition, a report was due to be given to the Council’s Strategic Environment, Planning and Transport on 16th March 2020 that reported on progress on some of the major schemes during the monitoring year, although the meeting was cancelled. This progress is summarised below.
| Scheme | Progress to 31 March 2020 |
|---|---|
| Cow Lane Bridges | Full scheme was completed April 2019. |
| South Reading Mass Rapid Transit | Phase 1A (between M4 J11 and Imperial Way) already complete at December 2016. Phase 1B and 2 (between Imperial Way and Lindisfarne Way) completed December 2017. Phases 3 and 4 (up to town centre) granted financial approval. Town centre sections of Phase 3 complete. The remaining elements of Phases 3 and 4 were expected to begin construction in Spring 2020 (for outbound bus lane between Rose Kiln Lane and Lindisfarne Way) or Summer 2020 (all other elements). Bid submitted to the DfT Pinch Point scheme for Phases 5 and 6, and other sources of funding being sought. |
| Green Park Station | Financial approval secured. Designs for interchange and surface car park produced, and works to deliver this underway. Design changes were required to station, and additional funding was secured to allow for this. Detailed design in preparation, and construction works expected to start March 2020 and be completed winter 2020. |
| Thames Valley Park Park and Ride | Permission for park and ride already granted by Wokingham Borough Council November 2016 and varied October 2018. Works are underway and were expected to complete April 2020. |
| National Cycle Network Route 422 | Phase 1 (Borough boundary to Berkeley Avenue) complete July 2017 Phase 2 (Berkeley Avenue through town centre) commenced January 2018 and expected to complete early 2019. Phase 3 (East Reading) scheme granted scheme and spend approval in November 2018, and commenced April 2019. |
| Reading West Station Upgrade | Council has been working with Great Western Railway and Network Rail on plans. Stepped access to town centre side delivered by Network Rail in 2019. Funding secured for improved facilities in November 2019, and detailed designs are being prepared. This does not include accessibility enhancements, and Council investigating further funding opportunity. |
| Third Thames Crossing | Production of Outline Strategic Business Case complete September 2017. High-level feasibility study completed in October 2019 and confirms feasibility of river crossing in the proposed location. Transport for the South East has submitted proposal to the DfT for consideration for funding. Council continuing to work with the Cross Thames Travel Group to progress the proposal. |
11 Natural environment
Key Policies (at end of monitoring year):
- EN7: Local Green Space and Public Open Space
- EN8: Undesignated Open Space
- EN9: Provision of Open Space
- EN10: Access to Open Space
- EN11: Waterspaces
- EN12: Biodiversity and the Green Network
- EN13: Major Landscape Features and Areas of Outstanding Natural Beauty
- EN14: Trees, Hedges and Woodlands
- EN18: Flooding and Drainage
Main strategic purpose of policies:
- Protect and, where appropriate, enhance areas of biodiversity significance
- Protect the character of key areas of landscape
- Prevent development from increasing the risk of flooding or increasing the risk to life and property from flooding
- Protect important areas of open space and avoid net loss of recreational public open space
11.1 The significant pressure for development in urban Reading is a key issue concerned with impact on biodiversity, including habitat destruction and degradation, pollution, climate change and introduced species. Although Reading is largely urban in nature, the town contains a number of green areas which are important for informal recreation and wildlife.
11.2 Local plan policy EN12 seeks to protect the biodiversity assets of the Borough. Developments should retain, protect and incorporate features of biodiversity or geological interest, whilst local nature reserves and wildlife heritage sites should be safeguarded. The policy also identifies the Green Network as comprising Local Wildlife Sites, Local Nature Reserves, Areas of Biodiversity Action Plan habitats, designated open space plus existing and potential Green Links. There is a requirement that the Green Links be maintained, protected, consolidated, extended and enhanced.
Indicator 30: Number of Local Wildlife Sites in positive conservation management
| Local wildlife sites | 2017-18 | 2018-19 | 2019-20 |
|---|---|---|---|
| Number of Local Wildlife Sites | 20 | 19 | 19 |
| Number of Local Wildlife Sites under positive conservation management | 17 | 16 | 16 |
| Percentage of Local Wildlife Sites under positive conservation management | 85% | 84% | 84% |
Source: Thames Valley Environmental Records Centre, 2020
11.3 There are no nationally (such as Sites of Special Scientific Interest) or internationally (such as Special Protected Areas) protected wildlife sites in Reading. However, there are a number of Local Wildlife Sites.
11.4 Local Wildlife Sites are non-statutory sites of importance for nature conservation that receive protection from the adverse impact of development under local planning policy. In Berkshire, existing and proposed sites are regularly assessed against a set of criteria by the Berkshire Local Wildlife Selection Panel, which comprises representatives from the Unitary Authorities in Berkshire and wildlife experts and organisations. The panel comprises representatives from Thames Valley Environmental Records Centre (TVERC), the local authorities in Berkshire, Berkshire, Buckinghamshire and Oxfordshire Wildlife Trust (BBOWT), Natural England and wildlife recorders. In Reading between 3 and 5 sites are surveyed each year and assessed by the selection panel.
11.5 The proportion of sites in positive conservation management in Reading has not changed from 2019, and remains at a very similar level to 2018.
11.6 Comparison with the rest of Berkshire: The proportion of sites in positive conservation management in Reading remains the highest in Berkshire and significantly higher than the overall Berkshire total of 66%.
Indicator 31: Area of Biodiversity Action Plan (BAP) priority habitats in Reading
| UK Biodiversity Action Plan Habitat | Area (hectares) |
|---|---|
| Coastal and floodplain grazing marsh | 124.5 |
| Eutrophic standing waters | 10.2 |
| Lowland beech and yew woodland | 2.4 |
| Lowland fens | 25.3 |
| Lowland meadows | 4.8 |
| Lowland mixed deciduous woodland | 110.5 |
| Open mosaic habitats on previously developed land | 34.8 |
| Ponds | 0.1 |
| Possible priority grassland habitat | 0.5 |
| Reedbeds | 1.1 |
| Rivers | 0.0 |
| Traditional orchards | 1.2 |
| Wet woodland | 9.9 |
| Wood pasture and parkland | 34.9 |
| Total | 360.2 |
11.7 The total area of priority habitat in RBC has been calculated at 360.2 ha, approximately 10% of the land area. TVERC carry out the analysis which is based on analysis of aerial photographs, and augmented by ground based observations in some situations. The most recent analysis was undertaken in summer 2020. The overall amount of priority habitat is lower than the last survey in 2018 (383.7 ha). Whilst there have been some on the ground changes, the bulk of this difference is simply down to differences in mapping and measuring from aerial photos rather than loss of habitats on the ground.
Indicator 32: Development in Major Landscape Features
| Residential dwellings (net change) | Non-residential floorspace (net change) | |
|---|---|---|
| Amount of development completed in Major Landscape Features | 0 | 0 sq m |
| Amount of development permitted in Major Landscape Features | 0 | 0 sq m |
11.8 There has been no net gain of dwellings or non-residential floorspace either permitted or completed in a Major Landscape Feature this year.
Indicator 33: Development in Flood Zones 2 and 3
| Residential dwellings (net change) | Non-residential floorspace (net change) | |
|---|---|---|
| Amount of development completed on sites wholly or partly in Flood Zones 2 and 3 | +149 | -4,334 sq m |
| Amount of development permitted on sites wholly or partly in Flood Zones 2 and 3 | +164 | -7,557 sq m |
11.9 In terms of permissions, around 33% of new permissions for residential have been on sites wholly or partly in flood zones 2 and 3. The largest such permissions have been for conversions from office to residential in the town centre, and this has also contributed to a net loss of non-residential floorspace on sites in flood zones 2 and 3.
11.10 Completions on sites wholly or partly in flood zones 2 and 3 have been around 28% of all completions. Primarily, this is the result of two sites, with Green Park Village and 5-9 Berkeley Avenue making up the large majority of completions. There has been a net loss of non-residential development on sites wholly or partly in flood zones 2 and 3, with this primarily as a result of demolition of retail warehouses at Kenavon Drive (only partly within flood zone 2) in advance of a residential development.
11.11 Given the location of significant parts of central Reading, along with some of the employment areas and Caversham district centre, within flood zones 2 and 3, it is not surprising that some level of development takes place, and the new Local Plan allocates a number of sites in flood zones 2 and 3. However, this is generally re-use of previously developed land, and is subject to the flooding tests in the NPPF.
Indicator 34: Gains and losses of public open space
| Site | Gain | Loss | Description |
|---|---|---|---|
| Mapledurham Playing Fields, Upper Woodcote Road | 0.51 | Development of part of open space for new primary school and pavilion extension | |
| Avon Place Play Area | 0.02 | Closure of play area | |
| Green Park Village | 0.04 | Informal open area | |
| Worton Grange, Imperial Way | 0.13 | Formal public open space serving development | |
| TOTAL | -0.36 |
11.12 The 2007 Open Spaces Strategy (OSS) mapped open space on the basis of access, as ‘unrestricted’, ‘limited’ or ‘restricted’. An update to this strategy was produced in 2018 to support the Local Plan. It is changes to unrestricted open space which is set out in the table above, as this is of greatest value in fulfilling a recreational function. It should be noted that not all ‘unrestricted’ open space is recreational public open space, as it may also include amenity land and town squares.
11.13 There has been a net loss of 0.36 ha in 2019-20. Whilst there have been some gains at major development sites at Worton Grange and Green Park Village, there has been a more significant loss of open space at Mapledurham Playing Fields, for the development of a new primary school, currently under construction. There has also been the closure of a play area at Avon Place, to be replaced by a new play area nearby at Canal Way that had not opened by the end of 2019-20.
11.14 For context, this follows on from a net gain of unrestricted open space over the 2007-2018 period of 12.228 ha. This was assessed in the Open Spaces Strategy 2018 Update Note and in the 2017-18 and 2018-19 AMRs. The overall unrestricted open space of Reading is estimated at 427 ha at the end of the monitoring year.
11.15 There has been a net loss of 6.80 ha of open space with ‘limited’ access over the 2019-20 period when compared to the areas mapped in 2007, and as updated in the 2018 update note and in 2017-19. However, this figure is misleading, as those areas had no recreational value. This was wholly development of inaccessible greenfield land at Green Park Village. There has been no change in ‘restricted’ open space.
Conclusion – Are policies fulfilling their purpose?
- Protect and, where appropriate, enhance areas of biodiversity significance
No significant loss of areas of biodiversity importance has taken place, and the proportion in positive conservation management remains the highest level in Berkshire.
- Protect the character of key areas of landscape
No development has been permitted or completed in the major landscape features.
- Prevent development from increasing the risk of flooding or increasing the risk to life and property from flooding
Whilst relatively significant levels of development are occurring in Flood Zones 2 and 3, this is reflective of the character of Reading, where the centre of Reading is partially within these areas. Development that is taking place in these areas is generally redevelopment or conversion, and should not therefore substantially affect water flows, whilst individual proposals have been subject to the requirement to demonstrate compliance with national and local flooding policies.
- Protect important areas of open space and avoid net loss of recreational public open space
There has been a small net loss in public open space with unrestricted access in 2019-20, as a result of a school development.
12 Historic environment
Key Policies (at end of monitoring year):
- EN1: Protection and Enhancement of the Historic Environment
- EN2: Areas of Archaeological Significance
- EN3: Enhancement of Conservation Areas
- EN4: Locally Important Heritage Assets
- EN5: Protection of Significant Views with Heritage Interest
- EN6: New Development in a Historic Context
Main strategic purpose of policies:
- Protect and where possible enhance heritage assets and their setting.
12.1 The Local Plan includes a number of policies relating to the historic environment, and is part of a much greater focus on heritage in recent years. The Council works with partners including the Reading Conservation Area Advisory Committee and Historic England to seek to protect and, where possible, enhance the significant assets that existing within Reading. This includes significant input from the local community.
Indicator 35: Loss of identified heritage assets
| Type of asset | Number in Reading (at 31/03/2020) | Lost 2019-20 | Loss permitted 2019-20 |
| Listed buildings* | 518 | 0 | 0 |
| Scheduled ancient monuments | 2 | 0 | 0 |
| Historic parks and gardens | 5 | 0 | 0 |
| Conservation areas | 15 | 0 | 0 |
| Building of townscape merit in conservation area | 924 | 0 | 0 |
| Locally listed building or structure | 13 | 0 | 0 |
*This is the number of listings, but some listings cover multiple buildings. There are more than 800 individual listed buildings.
12.2 No heritage assets have been lost, or agreed to be lost, in 2019-20.
Indicator 36: Heritage at risk
| Heritage asset at risk | Type | Condition |
| Russell Street/Castle Hill Conservation Area | Conservation area | Poor |
| Chazey Farm Barn, The Warren | Listed building | Very bad |
| Remains of Reading Abbey | Listed building | Fair |
12.3 Historic England’s Heritage at Risk Register was published in October 2019. The 2020 version was published in October 2020, and will be reported on next year. Three heritage assets were listed as ‘at risk’ in Reading, as set out above.
- Russell Street/Castle Hill Conservation Area: during the monitoring year, a draft conservation area appraisal for this area was published for consultation, which contained an action plan for the area. This was subsequently adopted in summer 2020.
- Chazey Farm Barn, The Warren: there was ongoing work between the owner, the Council and Historic England on work to prevent further decay during the monitoring year, and these works commenced in April 2020.
- Remains of Reading Abbey: Most of the ruins have now been addressed, with the main part of the ruins reopening to the public in 2018. However, one remaining part of the ruins, the mill arch, in private ownership, remains in need of consolidation.
12.4 The following assets were removed from the Heritage at Risk Register in 2019:
- St David’s Hall, Portland Place, 24-30 London Road: Works were undertaken to covert this building to residential, and secure the future of the building, and these works were completed in 2018.
- Sacred Heart, St John’s Road: There have been a number of phases of repair of this church, with the final phase being a Heritage Lottery Fund grant to deal with weathered stonework. The works completed in 2018.
Indicator 37: Changes to national heritage designations
12.5 There have been no designations or de-designations of national heritage designations (listed buildings, conservation areas, scheduled ancient monuments or historic parks and gardens) in Reading in 2019-20. Work has been underway on an extension of the Russell Street/Castle Hill conservation area (and renaming to Castle Hill/Russell Street/Oxford Road), but this did not formally take place until summer 2020 and will be reported in the next AMR.
Indicator 38: Changes to the list of locally-important buildings and structures
| Building | Date of addition to the list |
| Whole of the red brick front building of Gillette (which includes the clock tower), 452 Basingstoke Road, Reading | 11th April 2019 |
| King Edward Buildings, 1 Station Road/22 Friar Street, Reading | 7th February 2020 |
| 71-73 Caversham Road and related buildings including The Malthouse and 1 Northfield Road, Reading | 11th February 2020 |
12.6 There have been three additional buildings added to the local list, as set out above.
Indicator 39: Progress of conservation area appraisals
12.7 One conservation area appraisal, for Russell Street/Castle Hill, has been progressed in 2019-20. This was subject to public consultation between November 2019 and February 2020, and proposed a number of extensions of the conservation area boundary, as well as a name change to the Castle Hill/Russell Street/Oxford Road Conservation Area. Adoption of this took place after the end of the monitoring year, in summer 2020.
Conclusion – Are policies fulfilling their purpose?
- Protect and where possible enhance heritage assets and their setting
No loss of designated heritage assets has occurred. Two buildings have been removed from the at-risk register, and works are underway to address the remaining assets on the register. Three buildings have been added to the local list, and work was underway on a new conservation area appraisal that would result in extension of protection.
13 Local plan allocations
Key Policies (at end of monitoring year):
- CR11: Station/River Major Opportunity Area
- CR12: West Side Major Opportunity Area
- CR13: East Side Major Opportunity Area
- CR14: Other Sites for Development in Central Reading
- SR1: Island Road Major Opportunity Area
- SR2: Land North of Manor Farm Road Major Opportunity Area
- SR3: Land South of Island Road Major Opportunity Area
- SR4: Other Sites for Development in South Reading
- WR1: Dee Park
- WR2: Park Lane Primary School, The Laurels and Downing Road
- WR3: Other Sites for Development in West Reading and Tilehurst
- CA1: Sites for Development in Caversham and Emmer Green
- CA2: Caversham Park
- ER1: Sites for Development in East Reading
Main strategic purpose of policies:
- Identify sites to help to meet Reading’s development needs
13.1 The Local Plan identifies sites to meet much of Reading’s identified development needs. Most of these sites are primarily identified for housing, but there are also other needs, in particular for industry and warehouse uses, for which sites were identified.
Indicator 40: Progress of sites allocated in the Local Plan
13.2 The table below provides a brief update of the progress of the allocations in the Reading Borough Local Plan. The information presented is the latest position at 31st March 2020. Please note that there may have been further progress between the end of 2019-20 and publication, but this will be reported in the 2020-21 AMR and is not noted below.
| Site | Progress 2019-20 | Comments |
| CR11a: Friar Street & Station Road | Various | Permission 141043 for refurbishment of Thames Tower with four additional storeys for offices completed in 2018. Prior approval 141277 for conversion of Garrard House, 30 Garrard Street to 83 dwellings and permission 160328 for roof extension for 18 dwellings completed in 2018. Permission 181930 for hotel, offices and retail at 29 Station Road granted October 2019, not yet implemented. Prior approvals 180139, 182109 and 191446 for conversion of upper floors of 1 Station Road/22 Friar Street to between 11-15 dwellings approved in 2018 and 2019, not yet implemented. No progress on remainder of site. |
| CR11b: Greyfriars Road Corner | Permission | Permission 162210 for 135 dwellings and A1-A5, B1 and D2 uses at 52-55 Friar Street/1 Greyfriars Road granted March 2018, not yet implemented. Prior approval 170229 for conversion of 30 Greyfriars Road to 43 dwellings approved April 2017, not yet implemented. |
| CR11c: Station Hill | Permission | Site covered by outline permissions 190441 and 190442 and REM permissions 190465 and 190466, all granted March 2019, for comprehensive redevelopment for up to 538 dwellings and offices, retail and leisure. Demolition of most of site completed. Application 192032 (hybrid full/outline) for northern part of site for mix of uses submitted December 2019, not determined. |
| CR11d: Brunel Arcade and Apex Plaza | No progress | N/A |
| CR11e: North of Station | Application | Outline planning application 182252 for redevelopment of 80 Caversham Road for 620 dwellings, offices, retail, community, health centre submitted December 2018, not determined. Outline planning application 200328 for redevelopment of Vastern Court retail park for residential, offices, retail, hotel, community and leisure submitted February 2020, not determined. |
| CR11f: West of Caversham Road | No progress | N/A |
| CR11g: Riverside | Application | Application 200188 for redevelopment of majority of the site for residential and café submitted February 2020, not determined. |
| CR11h: Napier Road Junction | Under construction | Permission 162166 for 315 dwellings granted in November 2017, now under construction. Revised permission 190809 for 335 dwellings, granted March 2020, will not be implemented. |
| CR11i: Napier Court | No progress | N/A |
| CR12a: Cattle Market | No progress | N/A |
| CR12b: Great Knollys Street & Weldale Street | Part permission | Permission 170326 for 427 dwellings at land between Weldale Street and Chatham Street granted March 2018, demolition underway. Application 191086 for 10 dwellings and office space at Unit 16, North Street undetermined. No progress on remainder of site. |
| CR12c: Chatham Street, Eaton Place and Oxford Road | Part under construction | Permission 150721 for 16 dwellings at 114 Oxford Road granted February 2016, under construction. Prior approval 170979 for conversion of 125 Chatham Street to 8 dwellings approved August 2017, not yet implemented. Permission 180365 for conversion of buildings to the rear of the Butler, 85-91 Chatham Street to hotel granted March 2019, not yet implemented. Prior approval 190419 for conversion of Eaton Court, 106-112 Oxford Road to 58 dwellings approved May 2019, not yet implemented. No progress on remainder of site. |
| CR12d: Broad Street Mall | Application | Application 182137 for 446 dwellings above the mall resolved to grant subject to S106. Permission 182054 for 101-bed hotel at 20 Hosier Street granted November 2019, not implemented. Minster Quarter Development Framework, which includes this site, adopted 2018. |
| CR12e: Hosier Street | No progress | Minster Quarter Development Framework, which includes this site, adopted 2018. |
| CR13a: Reading Prison | No progress | N/A |
| CR13b: Forbury Retail Park | Part under construction | Permission 190509 for 765 dwellings on former Homebase & Toys R Us granted October 2018, under construction. No progress on remainder of site. |
| CR13c: Kenavon Drive and Forbury Business Park | No progress | N/A |
| CR13d: Gas Holder | Application | Application 190627 for 130 dwellings resolved to grant subject to S106. |
| CR14a: Central Swimming Pool, Battle Street | No progress | Site cleared. |
| CR14b: Former Reading Family Centre, North Street | Permission | Outline permissions 181652 and 181653, both for 47 dwellings with differing affordable housing mixes, granted March 2019, not yet implemented. Alternative full application 191659 for 41 dwellings resolved to grant subject to S106. |
| CR14c: 17-23 Queen Victoria Street | Under construction | Permission 181296 for alternative development of 19 serviced apartments granted January 2019, under construction. |
| CR14d: 173-175 Friar Street and 27-32 Market Place | Permission | Permission 180358 for 35 dwellings, office and retail granted January 2019, not yet implemented. |
| CR14e: 3-10 Market Place, Abbey Hall and Abbey Square | No progress | N/A |
| CR14f: 1-5 King Street | No progress | Permission 181566 for alternative change of use to offices granted January 2019, now completed. |
| CR14g: The Oracle Extension, Bridge Street and Letcombe Street | No progress | N/A |
| CR14h: Central Club, London Street | No progress | N/A |
| CR14i: Enterprise House, 89-97 London Street | No progress | N/A |
| CR14j: Corner of Crown Street and Southampton Street | No progress | N/A |
| CR14k: Corner of Crown Street and Silver Street | Under construction | Permission 170794 for 80 dwellings at 3-21 Crown St/27 Silver Street (majority of site) granted October 2017, under construction. Permission 180417 for 9 dwellings at corner of Newark Street and Crown Street (remainder of site) granted July 2018, under construction. |
| CR14l: 187-189 Kings Road | No progress | N/A |
| CR14m: Caversham Lock Island and Caversham Weir, Thames Side | Part permission | Permission 151715 for hydropower infrastructure at weir granted May 2017, not yet implemented. Remainder of site no progress. |
| SR1a: Former Landfill, Island Road | No progress | N/A |
| SR1b: North of Island Road | Completed | Permission 170444 for 11,067 sq m of industrial and warehouse space completed 2019. |
| SR1c: Island Road A33 Frontage | No progress | Existing permission for offices 050823 not expected to be built out. |
| SR2: Land north of Manor Farm Road | No progress | N/A |
| SR3: Land south of Elgar Road | No progress | N/A |
| SR4a: Pulleyn Park, Rose Kiln Lane | No progress | N/A |
| SR4b: Rear of 3-29 Newcastle Road | No progress | N/A |
| SR4c: 169-173 Basingstoke Road | No progress | N/A |
| SR4d: 16-18 Bennet Road | No progress | N/A |
| SR4e: Part of Former Berkshire Brewery Site | Application | Application 192054 for 15,045 sq m of industrial and warehouse space received December 2019, not yet determined. Existing unimplemented permission for offices 090530. |
| SR4f: Land south west of Junction 11 of the M4 | No progress | Part of wider Grazeley site for which HIF bid submitted (see paragraphs 3.4-3.8) |
| WR1: Dee Park | Part completed | Phases 1 and 2 completed. No planning application for Phase 3 yet submitted. |
| WR2: Park Lane Primary School, The Laurels and Downing Road | No progress | N/A |
| WR3a: Former Cox and Wyman site, Cardiff Road | Permitted | Planning permission 171814 granted November 2018. Demolition underway at end of monitoring year. |
| WR3b: 2 Ross Road and part of Meadow Road | No progress | N/A |
| WR3c: 28-30 Richfield Avenue | No progress | Alternative permission for extension and refurbishment of car dealership has now been completed. |
| WR3d: Rivermead Leisure Centre, Richfield Avenue | No progress | N/A |
| WR3e: Yeomanry House, Castle Hill | No progress | N/A |
| WR3f: 4 Berkeley Avenue | No progress | N/A |
| WR3g: 211-221 Oxford Road, 10 and rear of 8 Prospect Street | Part completed | Permission 150394 for 6 flats at 10 Prospect Street completed 2017. Permission 152313 for 2 flats to rear of 10 Prospect Street completed 2018. Prior approval 180658 for conversion of building to rear of 223 Oxford Road to 1 dwelling approved June 2018, completed 2020. Prior approval 191782 for conversion of building to rear of 8 Prospect Street to 5 dwellings approved December 2019, not yet implemented. Remainder of site no progress. |
| WR3h: Rear of 303-315 Oxford Road | No progress | N/A |
| WR3i: Part of former Battle Hospital, Oxford Road | Under construction | Permission 180319 for 211 dwellings granted October 2018, under construction, with 4 dwellings completed at end of 2019/20. No progress on small remaining part of site. |
| WR3j: Land at Moulsford Mews | No progress | Site still has permission for a health centre under original Battle Hospital permission 051348, not expected to be implemented. |
| WR3k: 784-794 Oxford Road | No progress | N/A |
| WR3l: 816 Oxford Road | No progress | N/A |
| WR3m: 103 Dee Road | No progress | N/A |
| WR3n: Amethyst Lane | No progress | N/A |
| WR3o: The Meadway Centre, Honey End Lane | Permission | Permission 150945 granted 2017 for development for redevelopment and refurbishment, not yet implemented. |
| WR3p: Alice Burrows Home, Dwyer Road | No progress | Site cleared. |
| WR3q: Norcot Community Centre, Lyndhurst Road | Application | Application 181377 for 18 dwellings and community use resolved to grant subject to S106 agreement. |
| WR3r: Charters Car Sales, Oxford Road | No progress | N/A |
| WR3s: Land at Kentwood Hill | No progress | N/A |
| WR3t: Land at Armour Hill | No progress | N/A |
| CA1a: Reading University Boat Club, Thames Promenade | No progress | N/A |
| CA1b: Part of Reading Golf Course, Kidmore End Road | No progress | N/A |
| CA1c: Land at Lowfield Road | No progress | Site in use for temporary housing. |
| CA1d: Rear of 200-214 Henley Road, 12-24 All Hallows Road, & 4, 7 & 8 Copse Avenue | Part permission | Permission 181306 in place for 2 houses at 4 Copse Avenue, not yet implemented. Remainder no progress. |
| CA1e: Rear of 13-14a Hawthorne Road & 282-292 Henley Road | Part completed | 4 dwellings completed under permission 161183. Remainder of site no progress. |
| CA1f: Rear of 1 & 3 Woodcote Road and 21 St Peter’s Hill | No progress | N/A |
| CA1g: Land west of Henley Road Cemetery | No progress | N/A |
| CA2: Caversham Park | No progress | N/A |
| ER1a: The Woodley Arms PH, Waldeck Street | Permission | Permission 171893 for student accommodation granted on appeal in October 2018, not yet implemented. |
| ER1b: Dingley House, 3-5 Craven Road | No progress | N/A |
| ER1c: Land rear of 8-26 Redlands Road | No progress | N/A |
| ER1d: Land adjacent to 40 Redlands Road | No progress | N/A |
| ER1e: St Patrick’s Hall, Northcourt Avenue | No progress | Application 172045 for development of 836 student bedrooms refused in February 2018, and appeal dismissed May 2019. |
| ER1f: Hamilton Centre, Bulmershe Road | No progress | Application 191634 for alternative development for Special Educational Needs college submitted October 2019, not determined. |
| ER1g: Alexander House, Kings Road | Permission | Permission 162057 for 56 dwellings granted in May 2017, not implemented. Application 190160 for student accommodation refused, and appeal submitted. |
| ER1h: Arthur Hill Swimming Pool, 221-225 Kings Road | No progress | N/A |
| ER1i: 261-275 London Road | No progress | N/A |
| ER1j: Palmer Park Stadium area | No progress | Palmer Park Development Framework to supplement ER1j adopted 2019. |
| ER1k: 131 Wokingham Road | No progress | N/A |
13.3 As the Local Plan was only adopted during the monitoring year, it is not surprising that little progress has been made on many of the allocated sites. However, there has been substantial progress on some sites, with a number of major allocations already under construction.
Conclusion – Are policies fulfilling their purpose?
- Identify sites to help to meet Reading’s development needs
Progress has been made on a number of sites, with some already under construction. On many sites no progress has been made, but this is to be expected so early after adoption.
14 Minerals
Key Policies (at end of monitoring year):
- M1: Husbanding Resources (RMLP)
- M2: Prevention of Sterilisation (RMLP)
- M2A: Extraction to Prevent Sterilisation (RMLP)
- M6: General Considerations for Sand and Gravel Extraction (RMLP)
- M7: Material Considerations for Sand and Gravel Extraction (RMLP)
- M8: Preferred Areas (RMLP)
- M10: Outside Preferred Areas Applications will Normally be Refused (RMLP)
- M11: Strongest Presumption Against Extraction (RMLP)
- M12: Strong Presumption Against Extraction (RMLP)
- M13: Strong Presumption Against Extraction all Other Areas (RMLP)
- M14: Borrow Pits (RMLP)
- M15: Building Sand (RMLP)
- M16: Chalk, Clay and Other Minerals (RMLP)
- M17: Oil and Gas (RMLP)
- M18: Appropriate and Timely Restoration (RMLP)
- M19: Securing Public Benefit through Restoration (RMLP)
- M20: Proposals for Restoration (RMLP)
- M21: Content of Minerals Applications (RMLP)
- M26: Safeguarding Rail Depots (RMLP)
- M28: Ancillary Structures (RMLP)
- M29: importing Aggregates to Plant Sites (RMLP)
14.1 The Council, together with four other unitary authorities in Berkshire (Wokingham, Bracknell Forest, Windsor and Maidenhead and Slough Boroughs) has historically produced separate reports for aggregates monitoring in Berkshire (Local Aggregate Assessments). This has now been taken over by Hampshire County Council on behalf of Reading, Wokingham, Bracknell Forest and Windsor and Maidenhead. For reasons of commercial confidentiality, these are not generally disaggregated to individual unitary authorities, as there may only be one operator producing aggregates in a particular authority. The latest Local Aggregate Assessment covers the data up to and including 2017. As Reading Borough has no active extraction facilities, no primary aggregates were won in Reading in 2019/20.
15 Waste
Key Policies (at end of monitoring year):
- W1: Sustainable Development (WLP)
- W3: Phasing Out Putrescible/Polluting Waste (WLP)
- W11: Proposed Preferred Areas (WLP)
- W13: Local Facilities (WLP)
- W14: Sites for Engineered Landfill (WLP)
- W15: Temporary Sites for Engineered Landfill (WLP)
- W16: Waste Management Facilities – Non-Landfill (WLP)
- W17: Green Waste Composting (WLP)
- W18: Sewage Works (WLP)
- W19: Farm and Stable Waste (WLP)
- W20: Other Landfill Sites for Putrescible/Polluting Waste (WLP)
- W21: Safeguarding Sites for Waste Management (WLP)
- W23: Temporary Local Separation Sorting and Recycling Sites (WLP)
- W24: Temporary Recycling Facilities on inert Waste Landfill Sites (WLP)
- W25: Disposal of Inert Waste by Landfilling (WLP)
- W26: Controls on Landfill Permissions to Secure Inert Waste Recycling (WLP)
- W27: Is Development Needed? (WLP)
- W28: Non-Identified Sites for Waste Management Development (WLP)
- W29: Non-Identified Sites for Waste Management Development outside Preferred Areas (WLP)
- W30: Assessing the Impact of Development Proposals (WLP)
- W31: Information to be Provided with Application (WLP)
- W33: Environmental Improvements and Wider Benefits (WLP)
- W34: Land Raising (WLP)
Main strategic purpose of policies:
- Ensure adequate capacity to manage waste arising
- Minimise the production of waste and manage it by more sustainable means further up the waste hierarchy.
Indicator 41: Capacity of new waste management facilities by type
15.1 No new waste management facilities have been permitted.
Indicator 42: Amount of Household Waste arising and managed by management type and the percentage each management type represents of the waste managed
| TOTAL HOUSEHOLD WASTE MANAGEMENT/ DISPOSAL (tonnes) | Household waste sent for Reuse, Recycling or Composting (tonnes) | Household Waste Sent For Energy Recovery (tonnes) | Household Waste Sent To Landfill (tonnes) | Household Waste sent to other Disposal Routes (tonnes) | Total Household Waste Collected (tonnes) |
|---|---|---|---|---|---|
| Reading Borough Council | 20,227.78 | 29,473.00 | 6,451.12 | 1,122.41 | 57,274.31 |
| HOUSEHOLD WASTE MANAGEMENT/ DISPOSAL (percentage) | Percentage HH waste sent for Reuse, Recycling or Composting | Percentage of household waste used for energy recovery | Percentage of household waste Landfilled | Percentage of household waste sent to other Disposal Routes |
|---|---|---|---|---|
| Reading Borough Council | 35.32% | 51.46% | 11.26% | 1.96% |
15.2 The overall amount of household waste collected is very slightly lower than the previous year. The proportion of waste sent for reuse, recycling or composting has increased over last year, whilst the proportion sent to energy recovery has slightly decreased. There has been a very slight reduction in the percentage sent to landfill, and this forms part of a longer term trend of reduction of landfill. The percentage sent to other disposal routes is lower than last year. This mainly involves wood for biomass.
Appendix 1: Planning policies as at 31 March 2020
Borough wide policies
| Type | Policies |
|---|---|
| Cross cutting policies | CC1: Presumption in Favour of Sustainable Development CC2: Sustainable Design and Construction CC3: Adaptation to Climate Change CC4: Decentralised Energy CC5: Waste Minimisation and Storage CC6: Accessibility and the Intensity of Development CC7: Design and the Public Realm CC8: Safeguarding Amenity CC9: Securing Infrastructure |
| Built and natural environment | EN1: Protection and Enhancement of the Historic Environment EN2: Areas of Archaeological Significance EN3: Enhancement of Conservation Areas EN4: Locally Important Heritage Assets EN5: Protection of Important Views with Heritage Interest EN6: New Development in a Historic Context EN7: Local Green Space and Public Open Space EN8: Undesignated Open Space EN9: Provision of Open Space EN10: Access to Open Space EN11: Waterspaces EN12: Biodiversity and the Green Network EN13: Major Landscape Features and Areas of Outstanding Natural Beauty EN14: Trees, Hedges and Woodland EN15: Air Quality EN16: Pollution and Water Resources EN17: Noise Generating Equipment EN18: Flooding and Drainage NRM6: Thames Basin Heaths Special Protection Area (SEP) |
| Economic development and employment | EM1: Provision of Employment EM2: Location of New Employment Development EM3: Loss of Employment Land EM4: Maintaining a Variety of Premises |
| Housing | H1: Provision of Housing H2: Density and Mix H3: Affordable Housing H4: Build to Rent Schemes H5: Standards for New Housing H6: Accommodation for Vulnerable People H7: Protecting the Existing Housing Stock H8: Residential Conversions H9: House Extensions and Ancillary Accommodation H10: Private and Communal Outdoor Space H11: Development of Private Residential Gardens H12: Student Accommodation H13: Provision for Gypsies and Travellers H14: Suburban Renewal and Regeneration |
| Transport | TR1: Achieving the Transport Strategy TR2: Major Transport Projects TR3: Access, Traffic and Highway-Related Matters TR4: Cycle Routes and Facilities TR5: Car and Cycle Parking and Electric Vehicle Charging |
| Retail, leisure and culture | RL1: Network and Hierarchy of Centres RL2: Scale and Location of Retail, Leisure and Culture Development RL3: Vitality and Viability of Smaller Centres RL4: Betting Shops and Payday Loan Companies RL5: Impact of Main Town Centre Uses RL6: Protection of Leisure Facilities and Public Houses |
| Other uses | OU1: New and Existing Community Facilities OU2: Hazardous Installations OU3: Telecommunications Development OU4: Advertisements OU5: Shopfronts and Cash Machines |
| Minerals development | M1: Husbanding Resources (RMLP) M2: Prevention of Sterilisation (RMLP )M2A: Extraction to Prevent Sterilisation (RMLP) M6: General Considerations for Sand and Gravel Extraction (RMLP) M7: Material Considerations for Sand and Gravel Extraction (RMLP) M8: Preferred Areas (RMLP) M10: Outside Preferred Areas Applications will Normally be Refused (RMLP) M11: Strongest Presumption Against Extraction (RMLP) M12: Strong Presumption Against Extraction (RMLP) M13: Strong Presumption Against Extraction all Other Areas (RMLP) M14: Borrow Pits (RMLP) M15: Building Sand (RMLP) M16: Chalk, Clay and Other Minerals (RMLP) M17: Oil and Gas (RMLP) M18: Appropriate and Timely Restoration (RMLP) M19: Securing Public Benefit through Restoration (RMLP) M20: Proposals for Restoration (RMLP) M21: Content of Minerals Applications (RMLP) M26: Safeguarding Rail Depots (RMLP) M28: Ancillary Structures (RMLP) M29: importing Aggregates to Plant Sites (RMLP) |
| Waste development | W1: Sustainable Development (WLP) W3: Phasing Out Putrescible/Polluting Waste (WLP) W11: Proposed Preferred Areas (WLP) W13: Local Facilities (WLP) W14: Sites for Engineered Landfill (WLP) W15: Temporary Sites for Engineered Landfill (WLP) W16: Waste Management Facilities – Non-Landfill (WLP) W17: Green Waste Composting (WLP) W18: Sewage Works (WLP) W19: Farm and Stable Waste (WLP) W20: Other Landfill Sites for Putrescible/Polluting Waste (WLP) W21: Safeguarding Sites for Waste Management (WLP) W23: Temporary Local Separation Sorting and Recycling Sites (WLP) W24: Temporary Recycling Facilities on inert Waste Landfill Sites (WLP) W25: Disposal of Inert Waste by Landfilling (WLP) W26: Controls on Landfill Permissions to Secure Inert Waste Recycling (WLP) W27: Is Development Needed? (WLP) W28: Non-Identified Sites for Waste Management Development (WLP) W29: Non-Identified Sites for Waste Management Development outside Preferred Areas (WLP) W30: Assessing the Impact of Development Proposals (WLP) W31: Information to be Provided with Application (WLP) W33: Environmental Improvements and Wider Benefits (WLP) W34: Land Raising (WLP) |
Area specific policies
| Area | Policies |
|---|---|
| Central Reading | CR1: Definition of Central Reading CR2: Design in Central Reading CR3: Public Realm in Central Reading CR4: Leisure, Culture and Tourism in Central Reading CR5: Drinking Establishments in Central Reading CR6: Living in Central Reading CR7: Primary Frontages in Central Reading CR8: Small Shop Units in Central Reading CR9: Terraced Housing in Central Reading CR10: Tall Buildings CR11: Station/River Major Opportunity Area CR12: West Side Major Opportunity Area CR13: East Side Major Opportunity Area CR14: Other Sites for Development in Central Reading CR15: The Reading Abbey Quarter CR16: Areas to the North of Friar Street and East of Station Road |
| South Reading | SR1: Island Road Major Opportunity Area SR2: Land North of Manor Farm Road Major Opportunity Area SR3: South of Elgar Road Major Opportunity Area SR4: Other Sites for Development in South Reading |
| West Reading and Tilehurst | WR1: Dee Park WR2: Park Lane Primary School, the Laurels and Downing Road WR3: Other Sites for Development in West Reading and Tilehurst |
| Caversham and Emmer Green | CA1: Sites for Development in Caversham and Emmer Green CA2: Caversham Park |
| East Reading | ER1: Sites for Development in East Reading ER2: Whiteknights Campus, University of Reading ER3: Royal Berkshire Hospital |
All policies Local Plan except:
- SEP – South East Plan (now revoked, but policy NRM6 retained)
- WLP – Waste Local Plan
- RMLP – Replacement Minerals Local Plan
Appendix II – Five year housing land supply
Reading Borough Council 5 year housing land supply against local plan targets as at 31/3/2020 for 2020/21 to 2024/25 including C3 dwellings only.
| Requirement | Number |
|---|---|
| Based on Local Plan 2013-2036 (policy H1) | 15,847 |
| Net Completions 2013-2019 | 4,074 |
| Net Completions 2019-2020 | 521 |
| Residual requirement 2020-2036 | 11,252 |
| Annual requirement for remaining 16 years, i.e. 11,252/16 | 703 |
| Annual requirement for remaining 16 years with 5% buffer (NPPF para 73) | 738 |
| Total requirement for 5 years 2020/21-2024/25, i.e. 738 x 5 | 3,692 |
| Supply | Number | |
|---|---|---|
| Hard commitments (strategic sites, i.e. 10 dwellings+) to be delivered 2020-2025 | 3,968 | |
| Soft commitments (strategic sites) subject to S106 to be delivered 2020-2025 | 405 | |
| Local Plan allocations to be delivered 2020-2025 | 0 | |
| Allowance for small site windfalls at 127 per annum | 635 | |
| Total site-specific supply for 5 years 2020/21-2024/25 | 4,922 |
This represents a 6.67 years supply (i.e. 4,922/738).
| Annual figures | 2020/21 | 2021/22 | 2022/23 | 2023/24 | 2024/25 |
|---|---|---|---|---|---|
| Total Annual Supply for Strategic Sites (including Lapsed Rate) | 319 | 829 | 892 | 1,304 | 943 |
| Total Annual Supply for Small Sites | 127 | 127 | 127 | 127 | 127 |
| Total supply (strategic + small) | 446 | 956 | 1019 | 1431 | 1071 |
Existing commitments not started
| Site address | Area (ha) | No of proposed dwellings | 2020/21 | 2021/22 | 2022/23 | 2023/24 | 2024/25 |
| Station Hill Site, Station Hill | 2.56 | 538 | 370 | 168 | |||
| Havell House, 62-66 Queens Road | 0.06 | 16 | 16 | ||||
| Greyfriars House, 30 Greyfriars Road | 0.12 | 43 | 43 | ||||
| Land between Weldale Street and Chatham Street | 1.32 | 422 | 253 | 126 | 43 | ||
| 1 Station Road and 22 Friar Street | 0.03 | 11 | 11 | ||||
| City Wall House, 26 West Street | 0.05 | 10 | 10 | ||||
| 33 Blagrave Street | 0.07 | 28 | 28 | ||||
| Former Cox & Wyman, Cardiff Road | 1.31 | 96 | 48 | 48 | |||
| Former Reading Family Centre, North Street | 0.23 | 47 | 47 | ||||
| Eaton Court, 106-112 Oxford Road | 0.44 | 58 | 58 | ||||
| Dukesbridge House, 23 Duke Street | 0.19 | 77 | 77 | ||||
| Dukesbridge Chambers, 1 Duke Street | 0.12 | 25 | 25 | ||||
| Sapphire Plaza, Watlington Street | 0.33 | 85 | 85 | ||||
| St Martins Precinct | 1.71 | 40 | 20 | 20 | |||
| 14 Arkwright Road | 0.33 | 37 | 37 | ||||
| 54 Queens Road | 0.16 | 20 | 20 | ||||
| 85-87 Basingstoke Road | 0.06 | 23 | 23 | ||||
| 34-38 Southampton Street | 0.03 | 10 | -1 | 11 | |||
| 1025-1027 Oxford Road | 0.19 | 12 | 12 | ||||
| Cadogan House, Rose Kiln Lane | 0.23 | 24 | 24 | ||||
| Dee Park Phase 3 | 16.4 | 108 | -82 | 95 | |||
| Alexander House, 205-207 Kings Road | 0.16 | 56 | 56 | ||||
| Aspen House, Kings Road (new build) | 0.06 | 14 | 14 | ||||
| Warwick House, Warwick Road | 0.15 | 10 | 10 | ||||
| 199-207 Henley Road | 0.96 | -3 | -3 | ||||
| Land at Madejski Stadium, Shooters Way | 19 | 618 | 98 | 98 | |||
| Former Sales and Marketing Suite, Drake Way | 0.26 | 12 | 12 | ||||
| TOTAL | 46.53 | 2,437 | -4 | 156 | 402 | 877 | 489 |
| TOTAL incl lapse rates (various) | 2,149 | -4 | 133 | 354 | 769 | 432 |
Existing commitments under construction
| Site address | Area (ha) | Number of proposed dwellings | 2020/21 | 2021/22 | 2022/23 | 2023/24 | 2024/25 |
|---|---|---|---|---|---|---|---|
| Jacksons Corner 1-9 Kings Road | 0.1 | 33 | 15 | ||||
| 114 Oxford Road | 0.14 | 16 | 16 | ||||
| 3-4 Wesley Gate | 0.07 | 18 | 14 | 4 | |||
| Clarendon House, 59-75 Queens Rd (conversion) | 0.22 | 49 | 49 | ||||
| Clarendon House, 59-75 Queens Rd (new build) | 0.21 | 43 | 4 | 39 | |||
| Former Cooper BMW, Kings Meadow Road | 0.49 | 315 | 315 | ||||
| Land at Kenavon Drive | 2.8 | 765 | 102 | 217 | 165 | 120 | |
| 1-2 Wesley Gate, Queens Road | 0.08 | 15 | 15 | ||||
| Former Battle Hospital Site, Portman Road | 2.78 | 211 | 44 | 99 | 49 | 15 | |
| 13-21 Crown Street and 27 Silver Street | 0.33 | 80 | 80 | ||||
| 83-85 London Street | 0.06 | 19 | 19 | ||||
| 5-9 Berkeley Avenue | 0.63 | 112 | 22 | ||||
| Green Park Village | 24.65 | 836 | 60 | 69 | 112 | 130 | 86 |
| Green Park Village Phase 6A | 1.44 | 339 | 76 | 112 | 83 | 68 | |
| TOTAL | 34 | 2,851 | 323 | 680 | 529 | 393 | 274 |
| TOTAL (no lapse rates on sites U/C) | 2,851 | 323 | 680 | 529 | 393 | 274 |
Permitted subject to S106
| Site address | Area (ha) | Number of proposed dwellings | 2020/21 | 2021/22 | 2022/23 | 2023/24 | 2024/25 |
|---|---|---|---|---|---|---|---|
| Unit 16, North Street | 0.04 | 10 | 10 | ||||
| Broad Street Mall, Broad Street | 2.75 | 422 | 148 | 134 | |||
| Gas Holder, Alexander Turner Close | 0.71 | 130 | 130 | ||||
| 53-55 Argyle Road | 0.04 | 10 | 10 | ||||
| Norcot Community Centre, Lyndhurst Road | 0.17 | 18 | 18 | ||||
| TOTAL | 3.71 | 590 | 0 | 18 | 10 | 158 | 264 |
| TOTAL incl lapse rates (10%) | 531 | 0 | 16 | 9 | 142 | 238 | |
| ALLOCATED LOCAL PLAN SITES WITHOUT PLANNING PERMISSION |
Allocated local plan sites without planning permission
0
Total for all (with lapse rates)
| Area (ha) | Number of proposed dwellings | 2020/21 | 2021/22 | 2022/23 | 2023/24 | 2024/25 | |
|---|---|---|---|---|---|---|---|
| TOTAL FOR ALL (with lapse rates) | 84.30 | 5,894 | 319 | 829 | 892 | 1,304 | 943 |
Reading Borough Council 5 year housing land supply against local plan targets as at 31/3/2020 for 2020/21 to 2024/25 including other forms of accommodation.
Only sites which are proposed for forms of accommodation other than C3, and for which the number of dwellings shown is therefore a dwelling equivalent, are shown below – the remaining sites are identical to the previous tables.
| Requirement | Number |
|---|---|
| Based on Local Plan 2013-2036 (policy H1) | 16,224 |
| Net Completions 2013-2019 | 4,202 |
| Net Completions 2019-2020 | 525 |
| Residual requirement 2020-2036 | 11,477 |
| Annual requirement for remaining 16 years, i.e. 11,477/16 | 717 |
| Annual requirement for remaining 16 years with 5% buffer (NPPF para 73) | 753 |
| Total requirement for 5 years 2020/21-2024/25, i.e. 753 x 5 | 3,766 |
| Supply | Number | |
|---|---|---|
| Hard commitments (strategic sites, i.e. 10 dwellings+) to be delivered 2020-2025 | 3,968 | |
| Soft commitments (strategic sites) subject to S106 to be delivered 2020-2025 | 405 | |
| Local Plan allocations to be delivered 2020-2025 | 0 | |
| Allowance for small site windfalls at 127 per annum | 635 | |
| Total site-specific supply for 5 years 2020/21-2024/25 | 5,008 |
This represents a 6.65 years supply (i.e. 5,008/753)
| Annual figures | 2020/21 | 2021/22 | 2022/23 | 2023/24 | 2024/25 |
|---|---|---|---|---|---|
| Total Annual Supply for Strategic Sites (including Lapsed Rate) | 359 | 829 | 938 | 1,304 | 943 |
| Total Annual Supply for Small Sites | 127 | 127 | 127 | 127 | 127 |
| Total Supply (Strategic + Small) | 486 | 956 | 1,065 | 1,431 | 1,071 |
| Site address | Area (ha) | Number of proposed dwellings | 2020/21 | 2021/22 | 2022/23 | 2023/24 | 2024/25 |
|---|---|---|---|---|---|---|---|
| Woodley Arms, Waldeck Street | 0.09 | 10 | 10 | ||||
| 199-207 Henley Road | 0.96 | 38 | -3 | 41 | |||
| Private car park, East Street | 0.13 | 26 | 26 | ||||
| 79 Silver Street | 0.1 | 14 | 14 |
Appendix III – Detailed housing trajectory against local plan targets
Appendix III AMR Housing Trajectory 2019-20 spreadsheet
Appendix IV – Local plan monitoring indicators
The following table lists the monitoring indicators in section 11 of the Local Plan (adopted 2019) and sets out the most recent figure, which is generally for 2019-20 unless otherwise stated. As the Local Plan was adopted part way through the monitoring year, a failure to meet targets in 2019-20 or in previous years does not necessarily therefore represent a failure of the plan itself.
Cross-cutting policies
| Indicator | Relevant policies | Target | Target date | Most recent figure | Total for plan period so far (2013-2020) | Compared to target | Comments |
|---|---|---|---|---|---|---|---|
| Carbon footprint of Reading Borough | General, CR2 | Reduce by 34% compared to 2005 levels | 2020 | Reduced by 46% compared to 2005 levels (2018, BEIS) | Reduced by 46% compared to 2005 levels (2018, BEIS) | Met | |
| Sustainability requirements attached to major planning applications approved | CR2, H5 | Requirements for all majors | Annual | 53% | 60% | Not met | See comments in section 5 |
| Contributions towards infrastructure secured through Section 106 agreements | CC9 | No specific target – maximise contribution | No specific target – maximise contribution | Receipt – £3,510,477.38 Expenditure – £1,738,662.40 | No total available | N/A | See comments in section 6 |
| Community Infrastructure Levy receipts and expenditure | CC9 | No specific target – maximise contribution | No specific target – maximise contribution | Receipt – £8,978,959.64 Expenditure – £20,191,288.91 | Receipt – £20,191,288.91 Expenditure – £7,285,379.96 | N/A | See comments in section 6 |
Built and natural environment
| Indicator | Relevant policies | Target | Target date | Most recent figure | Total for plan period so far (2013-2020) | Compared to target | Comments |
|---|---|---|---|---|---|---|---|
| Amount of public recreational open space | EN7 – EN9 | No net loss | By 2036 | -0.36 ha of unrestricted open space -0.40 ha of PROS -6.80 of ‘limited’ open space | 3.655 ha of unrestricted open space | On track (for unrestricted open space) | See comments in section 11 |
| Loss of open space to development | EN7, EN8 | None | Annual | -0.36 ha of unrestricted open space -0.40 ha of PROS -6.80 of ‘limited’ open space | 3.655 ha of unrestricted open space | On track (for unrestricted open space) | See comments in section 11 |
| New public open space brought into use through development | EN9 | Net gain | By 2036 | -0.36 ha of unrestricted open space -0.40 ha of PROS -6.80 of ‘limited’ open space | 3.655 ha of unrestricted open space | On track (for unrestricted open space) | See comments in section 11 |
| Number of Local Wildlife Sites in positive conservation management | EN12 | 80% | Annual | 84% | N/A | Met | |
| Area of Biodiversity Action Plan habitat | EN12 | No net loss | Annual | 360.2 ha (2020) | N/A | On track | Figure lower than at the start of plan period due to more accurate mapping. |
| Development in Major Landscape Features | EN13 | Dwellings – none Non residential floor space – none | Annual | 0 0 sq m | 2 965 sq m | Met | |
| Air quality targets in the UK Air Quality Strategy | EN15 | Various | 2020 | See 2019 Air Quality Annual Status Report | See 2019 Air Quality Annual Status Report | See 2019 Air Quality Annual Status Report | See 2019 Air Quality Annual Status Report |
| Development on sites wholly or partly in Flood Zones 2 and 3 | EN18 | Maximum 4000 dwellings Maximum 250,000 sq m non residential | By 2036 | 149 -4,334 sq m | 1,150 16,995 sq m | On track | See comments in section 11 |
Economic development
| Indicator | Relevant policies | Target | Target date | Most recent figure | Total for plan period so far (2013-2020) | Compared to target | Comments |
|---|---|---|---|---|---|---|---|
| Office floorspace completed (net change) | EM1 | 53,000 – 112,000 sq m | By 2036 | 4020 sq m | -93,797 sq m | Behind | See comments in section 7 |
| Industrial and warehouse floorspace completed (net change) | EM1 | 148,000 sq m | By 2036 | -699 sq m | 33,706 sq m | Behind | See comments in section 7 |
| Proportion of office floorspace completed which is in the centre or A33 corridor | EM2 | 90% | Annual | 97% | 95% | Met | |
| Proportion of industrial/warehouse floorspace completed which is in the A33 corridor or Core Employment Areas | EM2 | 80% | Annual | 100% | 90% | Met | |
| Net change of employment land within Core Employment Areas | EM3 | No net loss | Annual | 5773 sq m | -5,208 sq m | Met | |
| Net change in small business units (less than 150 sq m) | EM4 | No net loss | Annual | 0 units | -2 units | Met | |
| Net change in storage & distribution floorspace in south of Basingstoke Road | EM4 | No net loss | Annual | 0 sq m | -1160 sq m | Met |
Housing
| Indicator | Relevant policies | Target | Target date | Most recent figure | Total for plan period so far (2013-2020) | Compared to target | Comments |
|---|---|---|---|---|---|---|---|
| Five year housing land supply measured against targets in H1 | H1 | More than 5 years supply plus buffer* | Annual | 6.65 years | N/A | Met | See comments in section 8 |
| Amount of new housing delivered (net change) | H1 | 689 | Annual | 521 | 4595 | Not met | See comments in section 8 |
| Amount of new affordable housing delivered on new development sites. | H3 | 1. 30% on sites of 10+ dwellings 2. 20% on sites of 5-9 dwellings 3. 10% contribution on sites of 1-4 dwellings | Annual | 1. 27 dwellings + £567,000 secured. Equates to 3.6% ** 2. 2 dwellings + £78,250 secured. Equates to 5.1% 3. 7 dwellings + £463,316.25 secured. Equates to 17.1% | 1. 911 dwellings + £1.92 million secured. Equates to 19.3% 2. 23 dwellings + £1.44 million secured. Equates to 10.8% 3. 11 dwellings + £3.60 million secured. Equates to 10.2% | 1. Not met 2. Not met 3. Met | See comments in section 8 |
| New-build dwellings delivered by size and type | H2 | At least 50% 3-bed or more outside centre | Annual | 29% of 3-bed or more | 36% of 3-bed or more | Not met | |
| Percentage of new dwellings on previously-developed land | General | 90% | Annual | 88% | 90% | Not met | |
| Proportion of student accommodation delivered on non-FHE sites | H12 | None | annual | N/A | 97% | Met | |
| Net additional gypsy and traveller pitches | H13 | Not set | By 2036 | 0 | 0 | N/A | |
| Dwellings delivered and offices lost through office to residential prior approvals | General | Dwellings delivered – no target Net change in offices (sq m) – no target | N/A | 102 -3716 sq m | 1040 -52616 sq m | N/A |
* The buffer is generally 5%, unless over the plan period a track record of under-delivery is established, in which case the buffer rises to 20%
** To calculate an equivalent proportion, the total units secured through a S106 signed in the monitoring year is added to the financial contribution converted to units on the basis that delivering an affordable unit is estimated to cost £100,000 as calculated in evidence for the Local Plan examination. This is compared to the total number of units granted within developments that in policy terms should generate an affordable housing requirement.
Transport
| Indicator | Relevant policies | Target | Target date | Most recent figure | Total for plan period so far (2013-2020) | Compared to target | Comments |
|---|---|---|---|---|---|---|---|
| Delivery of identified transport projects in policy TR2 | TR2 | Various – see Local Transport Plan | See Section 9 |
Retail, leisure and culture
| Indicator | Relevant policies | Target | Target date | Most recent figure | Total for plan period so far (2013-2020) | Compared to target | Comments |
|---|---|---|---|---|---|---|---|
| Retail, leisure and culture floorspace delivered | RL2 | Up to 34,900 sq m | By 2036 | -10217 sq m | -30160 sq m | Behind | See comments in section 10 |
| Proportion of retail, leisure and culture floorspace delivered that is in a designated centre | RL1 | 80% | Annual | 66% | 69% | Not met | See comments in section 10 |
| Retail vacancy within designated centres | RL1 | Less than 10% | Biannual | 1. Overall 13.2% 2. Reading Centre 17.4% 3. Basingstoke Road 6.3% 4. Caversham 9.2% 5. Cemetery Junction 4.3% 6. Christchurch Road 14.3% 7. Coronation Square 0% 8. Dee Park 0% 9. Emmer Green 0% 10. Erleigh Road 7.1% 11. The Meadway 19.2% 12. Northumberland Avenue 0% 13. Oxford Road West 10.3% 14. Shinfield Road 3.4% 15. Tilehurst Triangle 5.8% 16. Wensley Road 0% 17. Whitley 10.3% 18. Whitley Street 8.1% 19. Whitley Wood 0% 20. Wokingham Road 10% | N/A | 1. Not met 2. Not met 3. Met 4. Met 5. Met 6. Not met 7. Met 8. Met 9. Met 10. Met 11. Not met 12. Met 13. Not met 14. Met 15. Met 16. Met 17. Not met 18. Met 19. Met 20. Not met | See comments in section 10 |
| Proportion of key frontages within district and local centres in A1or A2 use | RL3 | 1. Basingstoke Road 50% 2. Caversham 60% 3. Cemetery Junction 60% 4. Christchurch Road 60% 5. Coronation Square 60% 6. Dee Park 50% 7. Emmer Green 50% 8. Erleigh Road 50% 9. The Meadway 50% 10. Northumberland Avenue 50% 11. Oxford Road West 50% 12. Shinfield Road 50% 13. Tilehurst Triangle 50% 14. Wensley Road 60% 15. Whitley 60% 16. Whitley Street 40% 17. Whitley Wood 60% 18. Wokingham Road 50% | Annual | 1. Basingstoke Road 59.6% 2. Caversham 68.8% 3. Cemetery Junction 64.1% 4. Christchurch Road 72% 5. Coronation Square 56.9% 6. Dee Park 64.1% 7. Emmer Green 57.9% 8. Erleigh Road 56.7% 9. The Meadway 43.9% 10. Northumberland Avenue 58.3% 11. Oxford Road West 60.6% 12. Shinfield Road 49.9% 13. Tilehurst Triangle 75.8% 14. Wensley Road 80.7% 15. Whitley 68.3% 16. Whitley Street 50.7% 17. Whitley Wood 76.5% 18. Wokingham Road 63.6% | N/A | 1. Met 2. Met 3. Met 4. Met 5. Not met 6. Met 7> Met 8. Met 9. Not met 10. Met 11. Met 12. Not met 13. Met 14. Met 15. Met 16. Met 17. Met 18. Met |
Other uses
| Indicator | Relevant policies | Target | Target date | Most recent figure | Total for plan period so far (2013-2020) | Compared to target | Comments |
|---|---|---|---|---|---|---|---|
| Floorspace for community facilities (use class D1) delivered | OU1 | Net increase | Annual | 1450 sq m | 22614 sq m | Met | |
| Development for residential uses within the Consultation Zones for AWE Burghfield | OU2 | Middle zone – no target | Middle zone – no target | 44 dwellings | 379 dwellings | N/A | The Consultation Zone approach to AWE has been superseded, but this indicator is still useful as a general measure. |
| Development for residential uses within the Consultation Zones for AWE Burghfield | OU2 | Outer zone – no target | Outer zone – no target | 108 dwellings | 1089 dwellings | N/A | The Consultation Zone approach to AWE has been superseded, but this indicator is still useful as a general measure. |
| Development for non-residential uses within the Consultation Zones for AWE Burghfield | OU2 | Middle zone – no target | Middle zone – no target | 2263 sq m | -3849 sq m | N/A | The Consultation Zone approach to AWE has been superseded, but this indicator is still useful as a general measure. |
| Development for non-residential uses within the Consultation Zones for AWE Burghfield | OU2 | Outer zone – no target | Outer zone – no target | 13671 sq m | 67937 sq m | N/A | The Consultation Zone approach to AWE has been superseded, but this indicator is still useful as a general measure. |
Central Reading
| Indicator | Relevant policies | Target | Target date | Most recent figure | Total for plan period so far (2013-2020) | Compared to target | Comments |
|---|---|---|---|---|---|---|---|
| Dwellings completed in Central Reading (net change) | CR11, CR12, CR13, CR14 | 7,600 (approx.) | By 2036 | 61 | 1703 | Behind | Targets for areas are for general monitoring purposes and are not policy targets. |
| Office floorspace completed in Central Reading (net change) | CR11, CR12, CR13, CR14 | 71,000 sq m (approx.) | By 2036 | 1580 sq m | -57137 sq m | Behind | Targets for areas are for general monitoring purposes and are not policy targets. |
| Retail and leisure floorspace completed in Central Reading (net change) | CR11, CR12, CR13, CR14 | Up to 27,000 sq m (approx.) | By 2036 | -9078 sq m | -31649 sq m | Behind | Targets for areas are for general monitoring purposes and are not policy targets. |
South Reading
| Indicator | Relevant policies | Target | Target date | Most recent figure | Total for plan period so far (2013-2020) | Compared to target | Comments |
|---|---|---|---|---|---|---|---|
| Dwellings completed in South Reading (net change) | SR2, SR3, SR4 | 3,700 (approx.) | By 2036 | 225 | 1393 sq m | On track | Targets for areas are for general monitoring purposes and are not policy targets. |
| Industrial/warehouse floorspace completed in South Reading (net change) | SR1, SR4 | 155,000 sq m (approx.) | By 2036 | -278 sq m | 24,041 sq m | Behind | Targets for areas are for general monitoring purposes and are not policy targets. |
West Reading and Tilehurst
| Indicator | Relevant policies | Target | Target date | Most recent figure | Total for plan period so far (2013-2020) | Compared to target | Comments |
|---|---|---|---|---|---|---|---|
| Dwellings completed in West Reading and Tilehurst (net change) | WR1, WR2, WR3 | 2,400 (approx.) | By 2036l | 129 | 952 | On track | Targets for areas are for general monitoring purposes and are not policy targets. |
Caversham and Emmer Green
| Indicator | Relevant policies | Target | Target date | Most recent figure | Total for plan period so far (2013-2020) | Compared to target | Comments |
|---|---|---|---|---|---|---|---|
| Dwellings completed in Caversham and Emmer Green (net change) | CA1, CA2 | 700 (approx) | By 2036 | 6 | 106 | Behind | Targets for areas are for general monitoring purposes and are not policy targets. |
East Reading
| Indicator | Relevant policies | Target | Target date | Most recent figure | Total for plan period so far (2013-2020) | Compared to target | Comments |
|---|---|---|---|---|---|---|---|
| Dwellings completed in East Reading (net change) | ER1 | 1100 (approx) | By 2036 | 100 | 441 | On track | Targets for areas are for general monitoring purposes and are not policy targets. |
Where indicators are
judged against a running total, they are considered to be ‘behind’ if they are
more than 10% behind the annual average required to meet the total by
2036. Please note that being behind or
ahead of these annual averages does not necessarily mean that there should be any concerns about
meeting the overall 2036 target, as delivery will differ from year to
year. For instance, the overall homes to
be delivered in one part of Reading may be dependent on one or two sites which
are not expected to be delivered until later in the plan process. Delivery against these indicators will
ultimately need to be judged in 2036.
[1] The buffer is generally 5%, unless over the plan period a track record of under-delivery is established, in which case the buffer rises to 20%
[2] To calculate an equivalent proportion, the total units secured through a S106 signed in the monitoring year is added to the financial contribution converted to units on the basis that delivering an affordable unit is estimated to cost £100,000 as calculated in evidence for the Local Plan examination. This is compared to the total number of units granted within developments that in policy terms should generate an affordable housing requirement.
Last updated on 18/12/2020
Annual Monitoring Report 2019-20