Ethnicity Pay Gap Report for 2022
1. Purpose of the report
1.1 Large organisations are not yet legally required to publish their ethnicity pay gap. However, we have decided to voluntarily publish our ethnicity pay gap for the third year as we believe it is a fundamental step on the Council’s journey to improving workplace equality. We will use this information to help us reflect on what we are doing both internally and externally to achieve a truly diverse and inclusive organisation and where we need to take action to tackle inequality.
1.2 The ethnicity pay gap is the percentage difference in the average hourly pay rate for employees from minority ethnic groups compared to the average hourly pay rate for white employees. We calculate our ethnicity pay gap using largely the same methodology as set out in the Government regulations for calculating the gender pay gap. We also follow guidance issued by the Chartered Institute of Personnel and Development (CIPD)[1] who recommend that employers publish a uniform set of eight statistics comparing pay for Black, Asian and Minority Ethnic employees with white employees. In addition, we have broken this down further using the ONS Census’ five ethnicity categories so that we can identify any differences in more detail.
[1] Ethnicity Pay Reporting – a guide for employers – CIPD September 2021
1.3 Unlike for gender, our ethnicity disclosure rate is not at 100% (currently it is 94.8%). We will work towards improving this rate over the next 12 months by explaining to staff how we use this data to identify areas where there may be inequality so that we can take action to address it.
2. Introduction and background
2.1 Unlike for gender, our ethnicity disclosure rate is not at 100% (currently it is 94.8%). We will work towards improving this rate over the next 12 months by explaining to staff how we use this data to identify areas where there may be inequality so that we can take action to address it.
| Mean ethnicity pay gap | The difference between the mean hourly rate of pay of white full-pay relevant employees (FPREs)[2] and that of FPREs from minority ethnic groups. [2] See the Gov.uk website for a definition and examples of full-pay relevant employees (FPREs) relevant employees (FPREs) |
| Median ethnicity pay gap | The difference between the median hourly rate of pay of white FPREs and that of FPREs from minority ethnic groups. |
| Mean bonus gap | The difference between the mean bonus pay paid to white FPREs and that paid to FPREs from minority ethnic groups. |
| Median ethnicity pay gap | The difference between the median bonus pay paid to white FPREs and that paid to FPREs from minority ethnic groups. |
| Bonus proportions | The proportions of white FPREs and FPREs from minority ethnic groups who were paid bonus pay during the relevant period. |
| Quartile pay bands | The proportions of white FPREs and FPREs from minority ethnic groups in the lower, lower middle, upper middle and upper quartile pay bands. |
2.2 For the purpose of this report, the workforce profile at the ‘snapshot date’ date of 31 March 2021 was 1,624 full-pay relevant employees (FPREs). Data for schools’ staff is not included, nor is the children’s services workforce which transferred to a separate company, Brighter Futures for Children (BFfC), on 1 December 2018. Table 1 shows the make-up of the workforce by ethnic group.
Table 1 – mean and median ethnicity pay gap
| Number | Percentage | |
| Asian or Asian British | 91 | 5.8% |
| Black or Black British | 114 | 7.2% |
| Mixed | 51 | 3.2% |
| Other Ethnic Groups | 5 | 0.3% |
| White | 1,312 | 83.4% |
| Total | 1,573 | 100% |
Table 2 – Overall mean and median ethnicity pay gap and bonus pay gap for Black, Asian and Minority Ethnic Employees
| Black, Asian and Minority Ethnic Employees | White Employees | Black, Asian and Minority Ethnic Employees’ earnings are: | |
| Mean hourly rate | £16.70 | £17.16 | 2.68% lower |
| Median hourly rate | £15.88 | £15.60 | 1.76% lower |
| Mean amount of bonus | £1,000 | £1,000 | 0% higher |
| Median amount of bonus | £1,000 | £1,000 | 0% higher |
Table 2a – Mean and median ethnicity pay gap and bonus pay gap for Asian or Asian British Employees
| Asian or Asian British Employees | White Employees | Asian or Asian British Employees’ earnings are: | |
| Mean hourly rate | £17.96 | £17.16 | 4.7% higher |
| Median hourly rate | £15.60 | £15.60 | 0% higher |
| Mean amount of bonus | £1,000 | £1,000 | 0% higher |
| Median amount of bonus | £1,000 | £1,000 | 0% higher |
Table 2b – Mean and median ethnicity pay gap and bonus pay gap for Black or Black British Employees
| Black or Black British Employees | White Employees | Black or Black British Employees’ earnings are: | |
| Mean hourly rate | £14.93 | £17.16 | 13% lower |
| Median hourly rate | £14.20 | £15.60 | 9% lower |
| Mean amount of bonus | £1,000 | £1,000 | 0% higher |
| Median amount of bonus | £1,000 | £1,000 | 0% higher |
Table 2c – Mean and median ethnicity pay gap and bonus pay gap for employees from Mixed Ethnic Backgrounds
| Employees from Mixed Ethnic Backgrounds | White Employees | Employees from Mixed Ethnic Backgrounds’ earnings are: | |
| Mean hourly rate | £15.88 | £17.16 | 7.4% lower |
| Median hourly rate | £14.26 | £15.60 | 8.6% lower |
| Mean amount of bonus | £1,000 | £1,000 | 0% higher |
| Median amount of bonus | £1,000 | £1,000 | 0% higher |
Table 2d – Mean and median ethnicity pay gap and bonus pay gap for employees from Other Ethnic Groups
| Employees from Other Ethnic Groups | White Employees | Employees from Other Ethnic Groups’ earnings are: | |
| Mean hourly rate | £18.03 | £17.16 | 5.1% higher |
| Median hourly rate | £19.47 | £15.60 | 24.8% higher |
| Mean amount of bonus | £0 | £1,000 | 100% lower |
| Median amount of bonus | £0 | £1,000 | 100% lower |
Table 3 – Overall proportion of Black, Asian and Minority Ethnic Employees and White Employees who received a bonus
| Black, Asian and Minority Ethnic Employees | White Employees | |
| FPREs Total | 261 | 1,312 |
| Proportion of all those receiving a bonus | 3 (1.1%) | 17 (1.3%) |
Table 3a –Proportion of employees in each ethnic group who received a bonus
| Asian or Asian British | Black of Black British | Mixed Ethnic Backgrounds | Other Ethnic Backgrounds | White |
| 91 | 114 | 51 | 5 | 1,312 |
| 1 (1.1%) | 1 (0.9%) | 1 (2%) | 0 (0%) | 17 (1.3%) |
3. Analysis
3.1 Table 2 shows that the Council’s mean pay gap for Black, Asian and Minority Ethnic employees for 2022 is 2.68% (i.e. Black, Asian and Minority Ethnic employees are paid 2.68% lower than their white colleagues on average). There is a negative median pay gap of 1.76%, meaning that the median pay of white employees is 1.76% less than for Black, Asian and Minority Ethnic employees. Both figures have improved since 31 March 2021, when the mean pay gap was 4.26% and the median was 5.69%. In 2020, the mean pay gap was 6.88% and the median was 0.28%.
3.2
Nationally, in 2019 (the latest data available[3]), the median hourly pay for white ethnic employees was £12.40 per hour compared to those in minority ethnic groups at £12.11 per hour – a pay gap of 2.3%, its narrowest level since 2012. The pay gap was at its largest in 2014, at 8.4%.
[3] Source: Office for National Statistics – Annual Population Survey 2019
3.2 Tables 2a to 2d show this data broken down further for employees from different minority ethnic groups compared to their white colleagues. The mean pay gap is largest for employees who identify as Black or Black British, whose pay is 13% lower on average than their white colleagues, followed by employees from Mixed Ethnic backgrounds who are paid 7.4% less than white employees on average. There is a negative pay gap for employees who identify as Asian or Asian British, who are paid 7.4% more than their white colleagues on average. The mean and median pay gaps for staff who identify as from Other Ethnic Groups also have higher pay on average than white employees, although this group comprises only five people.
3.3 Tables 2 and 2a to 2d and Tables 3 and 3a show employees who received “bonuses” in the relevant period. The Council does not pay bonuses within its terms and conditions. However, long service awards in the form of money meet the Government’s definition of “bonus”.
3.4 Long service awards are in recognition of achieving 20 years’ continuous service. The Council is currently running two long service schemes with varying cash values:
- A one-off money award of £1,000 for those achieving long service with either the Council or a combination of the Council and Berkshire County Council, with the provision for employees to “trade in” all or part of the award for additional days’ leave, currently at the rate of £100 per day; or;
- £573 plus double leave for achieving 20 years’ service for employees appointed by the Council before 1 April 1999.
3.5 Twenty employees received long services awards in 2022. In all cases this was a one-off award of £1,000. There is no bonus pay gap for any group except for the five employees from Other Ethnic Groups, none of whom received a long service award. However it should be born in mind that all employees are eligible for this payment once they have reached the necessary service related requirements.
3.6 Figures 1 and 2 illustrate the breakdown of employees by ethnic group in each pay quartile. There are more white employees in every quartile and the proportion increases as pay increases, from 79.6% in the lower quartile to 87% in the upper quartile. All quartiles are broadly in line with the overall proportion of while employees in the workforce (83.4%).
3.7 Figures 3a to Figure 3d illustrate the breakdown of employees from each minority ethnic group compared to white employees by pay grade. At the highest paid end of the pay structure, there are employees from every ethnic group (an improvement since 2021, when there were no Asian or Asian British employees or employees from Other Ethnic Groups paid on Reading Senior Manager grades). However, this group is still predominantly white employees (84%).
Figure 1 – Proportion of employees in each pay quartile by ethnic group on 31 March 2022
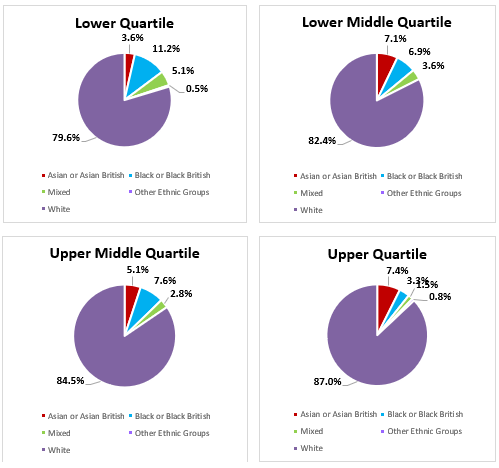
Figure 2 – Number of employees in each ethnic group on 31 March 2022
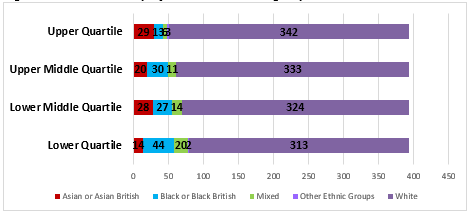
Figure 3a – Proportion of Asian or Asian British employees compared to White Employees in each pay band on 31 March 2022
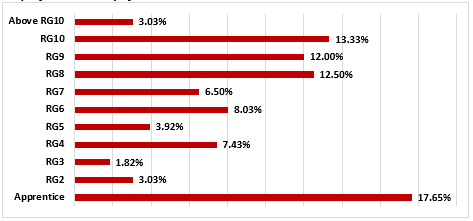
Figure 3b – Proportion of Black or Black British employees compared to White Employees in each pay band on 31 March 2022
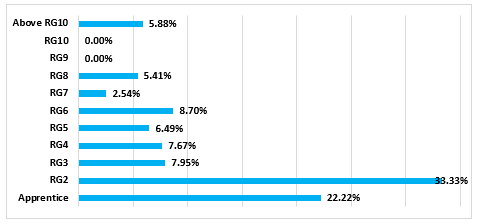
Figure 3c – Proportion of employees from Mixed Ethnic Backgrounds compared to White Employees in each pay band on 31 March 2022
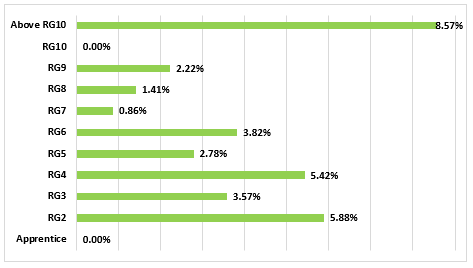
Figure 3d – Proportion of employees from Other Ethnic Groups compared to White Employees in each pay band on 31 March 2021
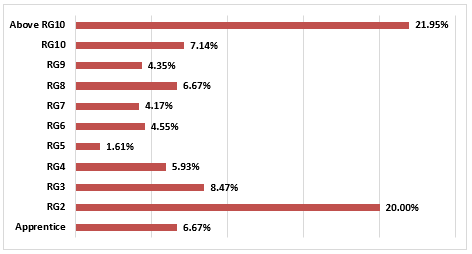
4. Action plan to reduce the ethnicity pay gap
4.1 Taking positive action on workplace equality can have significant benefits for an organisation’s reputation, culture and people. This Ethnicity Pay Gap report, along with our Gender Pay Gap and Workforce Profile reports, are a fundamental step on the Council’s journey to improving workplace equality. It helps to create a baseline to track current progress and drive continual improvement.
4.2 This report will be highlighted to all staff and elected members, and will be published on our website, as part of our approach to improve inclusion and tackle inequality in the workplace.
4.3 There is a small proportion of employees (5.2%) who have either not been asked to provide their ethnicity or have chosen a ‘prefer not to say’ response. Low ethnicity disclosure rates are a problem for many employers, but the information is vital to help address any ethnicity pay gaps accurately and for producing effective action plans. We will therefore seek to encourage all employees to disclose their ethnicity, explaining how we use this data.
4.4 We will continue to promote the benefits of working for the Council both internally and externally, such as flexible hours and hybrid working arrangements, our diversity commitments etc. We will increase awareness about apprenticeship schemes to encourage more employees to enhance their skills and qualifications, giving them greater opportunities to progress their careers.
4.5 We will ensure that all promotion opportunities are advertised internally to our staff to embed a culture where we grow our own talent from within the Council.
4.6 We will continue to deliver recruitment and selection training which all recruiting managers are required to complete, which highlights the issue of unconscious bias during recruitment and interview processes and seeks to eliminate it.
4.7 We will continue to ensure that recruiting managers use structured interviews as this is more effective at guarding against unconscious bias by ensuring that all candidates are asked the same questions and are assessed using pre-specified, standardised criteria.