Gender Pay Gap Report for 2022
1. Purpose of the report
1.1 Under the Equality Act 2010 (Specific Duties and Public Authorities) Regulations 2017, employers with 250 or more employees must publish gender pay gap information every year.
1.2 To make the calculations, data must be gathered from the Council’s payroll from a specific date each year. This is called the ‘snapshot date’, which is 31 March for public sector organisations. Data for agency workers is not included in this report as they are not on the Council’s payroll.his date is called the ‘snapshot date’, which is 31 March for public sector organisations.
1.3 The calculations for 31 March 2022 will be published on the Council’s website and the Government Equalities Office website (this must be done by 30 March 2023). This report sets out the figures that will be published and the plans for improving the Council’s small gender pay gap.
2. Introduction and background
2.1 The averages used in this report are mean and median. A mean average is calculated by totalling all the values in a dataset; this total is then divided by the number of values that make up the dataset. The median of a group of numbers is the number in the middle, when the numbers are in order of magnitude.
| Mean gender pay gap | The difference between the mean hourly rate of pay of male full-pay relevant employees (FPREs)[1] and that of female full-pay relevant employees. [1] See the Gov.uk website for a definition and examples of full-pay relevant employees (FPREs) |
| Median gender pay gap | The difference between the median hourly rate of pay of male full-pay relevant employees and that of female full-pay relevant employees. |
| Mean bonus gap | The difference between the mean bonus pay paid to male relevant employees and that paid to female relevant employees. |
| Median gender pay gap | The difference between the median bonus pay paid to male relevant employees and that paid to female relevant employees. |
| Bonus proportions | The proportions of male and female relevant employees who were paid bonus pay during the relevant period. |
| Quartile pay bands | The proportions of male and female full-pay relevant employees in the lower, lower middle, upper middle and upper quartile pay bands. |
2.2 The workforce at the ‘snapshot date’ of 31 March 2022 was 1,660 full-pay relevant employees (FPREs), which is made up by 985 (59.3%) women and 675 (40.6%) men.
2.3 In accordance with Government guidance, data for school staff is not included, nor is the children’s services workforce which transferred to Brighter Futures for Children (BFfC) on 1 December 2018. BFfC report their gender pay gap separately. workforce which transferred to Brighter Futures for Children (BFfC) on 1 December 2018. BFfC report their gender pay gap separately.
2.4In relation to gender identity, if an employee does not self-identify as either male or female, the individual would be omitted from the calculations in accordance with the Government’s guidance. At the Council’s, 100% of employees had disclosed their sex so there was no requirement to omit any data for this reason.
Table 1 – mean and median gender pay gap
| Men | Women | Women’s earnings are: | |
| Mean Hourly Rate | £17.10 | £17.07 | 0.13% lower |
| Median Hourly Rate | £15.60 | £15.12 | 3.06% lower |
Table 2 – mean and median gender pay gap in bonus payments
| Men | Women | Women’s bonuses are: | |
| Mean amount of bonus | £1,000 | £1000 | 0% lower |
| Median amount of bonus | £1,000 | £1,000 | 0% higher |
Table 3 – Proportion of men and women who received a bonus
| Men | Women | |
| FPREs Total | 675 | 985 |
| Proportion of all those receiving a bonus | 4 (0.59%) | 17 (1.73%) |
3. Analysis
3.1
The Council’s mean (0.13%) and median (3.06%) gender pay gap(as shown in Table 1) have reduced since 2021 when they were 2.06% and 4.91%. They also compare favourably with the national average gender pay gap figure for 2021 (the latest data available) for full and part time employees which was 15.4% (up from 14.9% in 2020)[2].
[2] ONS data – Gender pay gap in the UK: 2021
3.2 Tables 2 and 3 reflect 21 people who received “bonuses” in the relevant period. These are exclusively long service awards in the form of money, which meet the government’s definition of bonus. The Council does not pay any other type of bonus.
3.3 Long service awards are in recognition of achieving 20 years’ continuous service. The Council is currently running two long service schemes with varying cash values:
- A one-off money award of £1,000 for those achieving long service with the Council or a combination of the Council and Berkshire County Council, with the provision for employees to “trade in” all or part of the award for additional days’ leave, currently at the rate of £100 per day; or
- £573 plus double leave for achieving 20 years’ service for employees appointed by the Council before 1 April 1999.
3.4 Four men and 17 women received long services awards, and in all cases, this was a one-off award of £1,000. This translates into a 0% pay gap. It should be born in mind that all employees are eligible for this payment once they have reached the necessary service-related requirements.
3.5 The Council’s workforce is predominantly women (59.3%). There are more women than men at every pay quartile, yet half of women are in the lower middle and upper middle pay quartiles (see Figures 1 and 2 below).
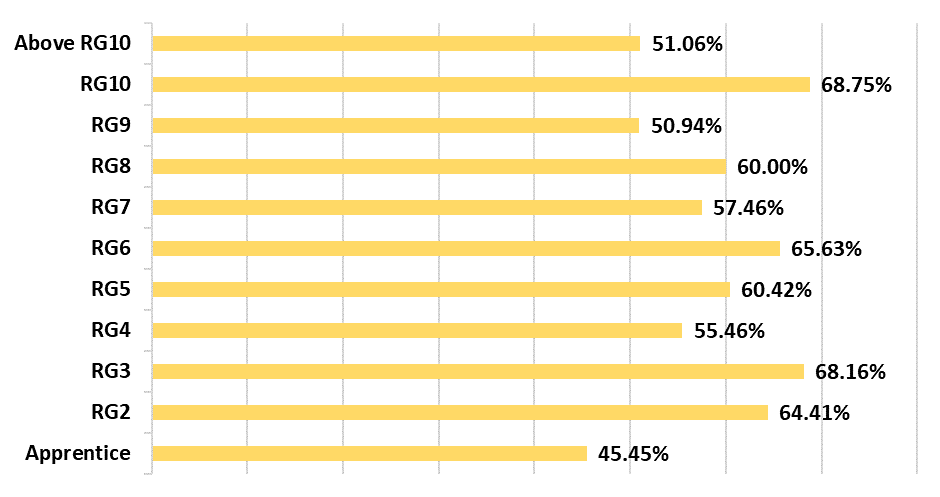
3.6The proportion of women above RG10 (i.e. earnings above £55,577 per annum) is 51%, up from 46% last year. This is lower than the overall proportion of women at 59.3%. This is largely where the Council’s gender pay gap comes from. An action plan for improving the Council’s gender pay gap is included in Section 5 of this report.
Figure 1: Proportion of men and women in each pay quartile on 31 March 2021


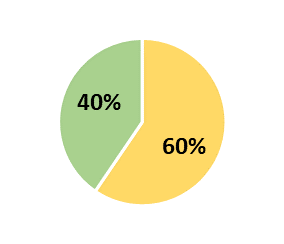
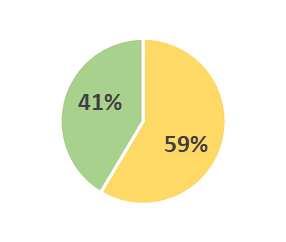

Figure 2 – Number of men and women in each pay quartile on 31 March 2022
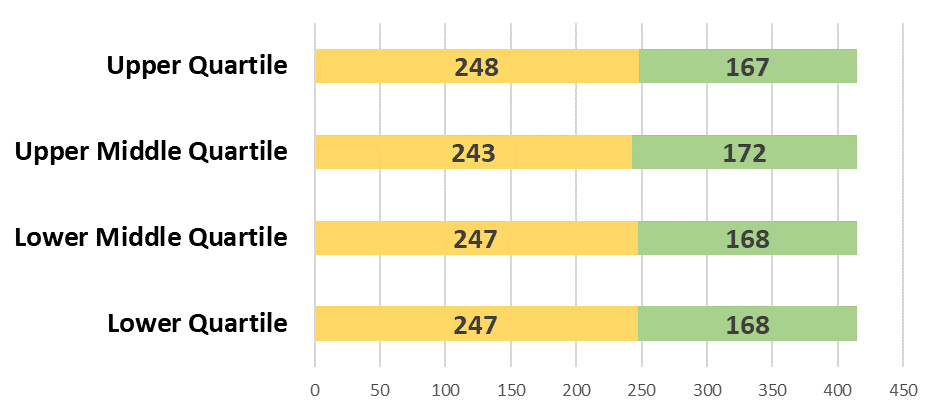
Figure 3: Proportion of women in each pay band on 31 March 2022
4. Conclusions
4.1 The small gender pay gap at the Council, which is much lower than the national average, is the result of the long-term effort that the Council has invested to ensure fair pay for all staff, including:
- Promotion of the Council’s low gender pay gap through posts on the Council’s social media channels.
- Promoting and supporting flexible working policies for all employees, irrespective of gender, including job share, part time working and term time working. This also includes the new Flexible Workstyles Framework which is focused on giving our staff the flexibility to choose, where feasible, where they do their work, whether that’s in the office or working remotely.
- Promoting the Council as a great place to work by running workshops and drop-in clinics in local job centres and schools.
- Having a clear policy of paying employees equally for the same or equivalent work, regardless of gender, and carrying our equality audits every year to check this is happening.
- Having an objective job evaluation scheme to ensure pay fairness.
- Formal authorisation process for any changes in pay, including accelerated increments, market supplements and pay at starting appointments.
- Offering the right to request flexible working to all staff with no qualifying length of service required.
- Enhanced Shared Parental Pay to mirror contractual Maternity Pay.
- Became an accredited “Living Wage Employer” in 2014.
- Engaging with working parents who are home-schooling during the pandemic, to reinforce the Council’s flexible working approach.
5. Action plan
5.1 Continue to promote the benefits of flexible working practices to employees and managers. In addition, the Council will monitor the take-up of flexible working arrangements by gender and level within the organisation.
5.2 Promote the benefits of working for the Council both internally and externally, such as apprenticeship opportunities, flexible working arrangements, diversity commitments etc.
5.3 Continue to require recruiting managers to attend the Council’s recruitment and selection training which highlights the issue of unconscious bias during recruitment and interview processes.
5.4 Continue to ensure that recruiting managers use structured interviews as this is more effective at guarding against unconscious bias by ensuring that all candidates are asked the same questions and are assessed using pre-specified, standardised criteria.
5.5 Increase awareness about apprenticeship schemes to encourage more employees to improve their skills and experience giving them the opportunity to progress their career.
Last updated on 02/02/2024
Gender Pay Gap Report for 2022