2024 – 2029 Air quality action plan
In fulfilment of Part IV of the Environment Act 1995
Local Air Quality Management 2024 – 2029
On this page:
- Foreword
- Executive summary
- Introduction
- Summary of current air quality in Reading
- Reading Borough Council’s air quality priorities
- Development and implementation of Reading Borough Council’s AQAP
- AQAP measures
- Appendix A: Response to consultation
- Appendix B: Reasons for not pursuing action plan measures
- Appendix C: Current UK air quality standards and objectives
- Glossary of terms
Foreword
Foreword from Cllr John Ennis, Lead Councillor for Climate Strategy and Transport
We are very pleased to present the updated Air Quality Action Plan (AQAP) for Reading that sets out our vision for delivering air quality improvements across our borough over the next five years.
During the challenging times of the Covid-19 pandemic we had periods in the lockdowns where we experienced a slowdown in traffic numbers that resulted in noticeable environmental benefits. We saw temporary improvements in air quality across Reading during this period, and this coincidentally showed us the level of actions needed to reduce pollution.
The Reading AQAP was initially drafted during the Covid-19 pandemic (2020 and 2021) and has since been reviewed and updated. During this period, we have looked at the current situation around air quality, evaluated options to improve it and have explored future opportunities for improving local air quality for our residents, visitors, businesses and the environment.
Improving air quality goes hand in hand with the Council’s major policy areas, including health and social inequality, the Climate Emergency Strategy, the Reading Transport Strategy and Reading’s 2050 Vision. We will drive the change in partnership with all communities across Reading by focusing on three themes:
- Healthy environment
- Thriving communities
- Inclusive economy
Reading’s air quality is improving, however, we still have some locations in the borough which are above the UK and World Health Organization (WHO) air quality limits. This Action Plan will target these locations but not just for compliance with UK or WHO standards, but to push further to improve air quality for the sake of residents’ health across the whole of Reading.
This Action Plan identifies the areas where we need to work together to improve air quality. With your support, these actions will help to benefit people’s quality of life, the environment and improve the communities we all live in by having cleaner air.
Executive summary
This Air Quality Action Plan (AQAP) has been produced as part of our statutory duties required by the Local Air Quality Management framework. It outlines the action we will take to improve air quality in Reading between 2024 and 2029.
This action plan replaces the previous action plan which ran from 2016 to 2020. Since 2016, we have made substantial progress in our attempts to enable improvements in air quality. Projects delivered through the past action plan include:
- Construction of Green Park Station, which formally opened in May 2023. The new railway station offers a sustainable travel alternative to private vehicle use, connecting the Green Park business area, Select Car Leasing (Madejski) Stadium and the Green Park Village residential area to the Great Western Railway line.
- Commencement of the Southern Bus Rapid Transit (BRT) corridor, offering a sustainable travel option connecting the south of Reading to central Reading which will be largely unaffected by local road congestion.
- Introduction of Park & Ride schemes at Thames Valley Park, Winnersh Triangle and Mereoak, to reduce the number of car trips to central Reading, thereby reducing congestion and emissions.
- Provision of the National Cycle Network 422, offering a safer east-west cross-town route, to encourage and prioritise active travel.
- Construction of Christchurch Bridge in September 2015, which offers a link to pedestrians and cyclists exclusively, connecting central Reading to Caversham’s riverside areas, to further encourage and prioritise active travel.
- Reading’s bus fleet has received substantial investment in recent years, enabling the retrofitting of buses with newer, cleaner exhaust engines. 100% of Reading’s bus fleet now comprises hybrid, natural gas or Euro 6 diesel engines, making the fleet one of the cleanest in the UK.
- In 2020, Reading Borough Council introduced a taxi emissions policy and reduced taxi licensing fees for ultra-low emission and electric vehicle drivers, by 25% and 50%, respectively. This will encourage the uptake of low- or -zero- emission taxis, reducing the air quality impacts these have on the local road network.
The above list of projects is not inclusive of all the successful measures undertaken by Reading Borough Council in recent years, but the list serves to highlight some of the key achievements made to improving air quality across Reading.
The previous AQAP focussed on actions to reduce nitrogen dioxide (NO2) emissions, with the intention of achieving compliance with national objectives. This new AQAP continues these ambitions, but also places considerable emphasis on targeting PM2.5 emission reductions. This is to align with the increasing evidence around PM2.5 being extremely harmful to health, and the changes to national policy that have followed as a result.
Air pollution is associated with a number of adverse health impacts. It is recognised as a contributing factor in the onset of heart disease and cancer. Additionally, air pollution particularly affects the most vulnerable in society: children and older people, and those with heart and lung conditions. There is also often a strong correlation with equalities issues, because areas with poor air quality are also often the less affluent areas[1],[2].
The annual health cost to society of the impacts of particulate matter alone in the UK is estimated to be around £16 billion[3]. Reading Borough Council is committed to reducing the exposure of people in Reading to poor air quality in order to improve health.
We have developed actions that can be considered under six broad topics:
- Policy guidance and development control
- Promoting low emission plant
- Promoting low emission transport
- Public information
- Transport planning and infrastructure
- Traffic management
Our priorities are to tackle emissions from local transport sources that impact on key locations and communities by developing policies and infrastructure plans to enable the prioritisation of sustainable and active travel modes.
Policy is to be developed to tackle domestic wood burning in Reading along with local planning guidance to better manage and control development emissions. Other initiatives include setting up a service for alerting and protecting vulnerable individuals during air pollution episodes and developing and implementing an Electric Vehicle Infrastructure Strategy.
In this AQAP we outline how we plan to effectively tackle air quality issues within our control. However, we recognise that there are a large number of air quality policy areas that are outside of our influence (such as vehicle emissions standards), but for which we may have useful evidence, and so we will continue to work with regional and central government on policies and issues beyond Reading’s direct influence.
Responsibilities and commitment
This AQAP was prepared by the Phlorum Limited and the Principal Air Quality Project Officer of Reading Borough Council with the support and agreement of the following officers and departments:
- Assistant Director, Planning, Transport & Public Protection: James Crosbie.
- Regulatory Services – Public Protection Manager: Matt Golledge.
- Regulatory Services – Community Protection Manager: Catherine Lewis.
- Public Health and Wellbeing Team – Public Health Consultant: Martin White.
- Transport – Transport Programme Manager: Chris Maddocks.
- Transport – Project Manager: James Clements.
- Transport – Senior Transport Planner: James Turner.
- Head of Climate Strategy: Peter Moore.
- Sustainability Manager: Ben Burfoot.
- Public Health: David Munday.
- Planning – Planning Policy Manager: Mark Worringham.
This AQAP has been approved by:
Keith Townsend – Executive Director for Economic Growth & Neighbourhood Services
Ruth McEwan – Lead Councillor Education and Public Health
John Ennis – Lead Councillor for Climate Strategy & Transport
This AQAP has been signed off by a Director of Public Health.
John Ashton – Interim Director for Public health
This AQAP will be subject to an annual review, appraisal of progress and reporting to the Strategic Environment, Planning and Transport Committee. Progress each year will be reported in the Annual Status Reports (ASRs) produced by Reading Borough Council, as part of our statutory Local Air Quality Management duties.
If you have any comments on this AQAP please send them to Ross Jarvis at:
Address: Reading Borough Council, Civic Centre, Bridge Street, Reading, RG1 2LU
Telephone: 0118 937 2314 Email: Ross.Jarvis@reading.gov.uk.
1. Introduction
This report outlines the actions that Reading Borough Council will deliver between 2024-2028 in order to reduce concentrations of air pollutants and exposure to air pollution; thereby positively impacting on the health and quality of life of residents and visitors to the borough of Reading.
It has been developed in recognition of the legal requirement on the local authority to work towards Air Quality Strategy (AQS) objectives under Part IV of the Environment Act 1995 and relevant regulations made under that part and to meet the requirements of the Local Air Quality Management (LAQM) statutory process. This Plan will be reviewed every five years at the latest and progress on measures set out within this Plan will be reported on annually within Reading Borough Council’s air quality ASR (Annual Status Report).
2. Summary of current air quality in Reading
Please refer to the latest ASR from Reading Borough Council for full details of air quality monitoring and information.
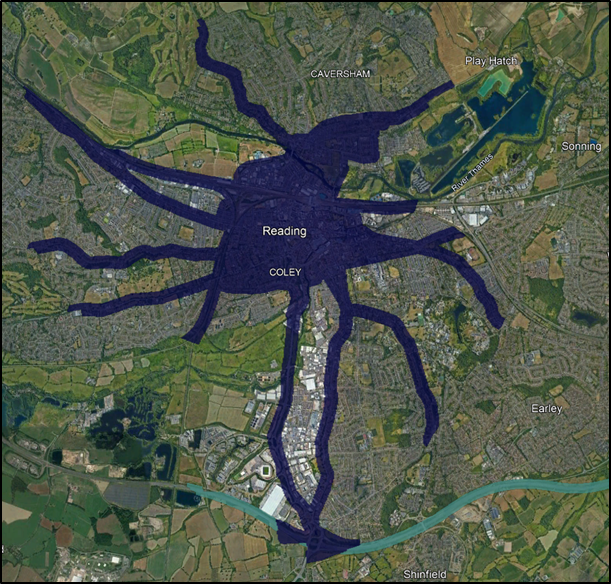
2.1 Reading Air Quality Management Area
The current Reading Air Quality Management Area (AQMA), shown in Figure 1, extends out from the central Inner Distribution Road (IDR) zone along the main arterial roads and along some rail routes passing through Reading. The AQMA was declared due to exceedances of the annual mean UK Air Quality Strategy (AQS) Objective for nitrogen dioxide (NO2) in 2009. Full details of the UK’s air quality standards and objectives are provided in Appendix C, for reference.
2.2 Air quality monitoring
Reading Borough Council monitors for NO2, particulates with diameters of 10 microns or less (PM10), particulates with diameters of 2.5 microns or less(PM2.5) and ozone (O3) at a number of locations across the borough.
There are four automatic air quality monitoring stations (AQMS) in Reading [monitoring pollutants]:
- Reading AURN[4] Urban Background AQMS [NO2; PM10; PM2.5; O3]
- RD1 Roadside AQMS [NO2; PM10]
- RD3 Roadside AQMS [NO2; PM10]
- RD4 Roadside AQMS [NO2; PM10]
Reading also has a network of non-automatic NO2 diffusion tubes monitoring concentrations at 56 locations. The majority of monitoring locations in Reading are at the roadside, with only 1 site at an urban background location (the Reading AURN AQMS).
2.2.1 2019 and 2022 Monitoring Results
Due to the influence of the Covid-19 lockdowns during 2020/21, baseline air quality information presented in this AQAP is based on pre-Covid-19 data from 2019, and post-Covid-19 data from 2022.
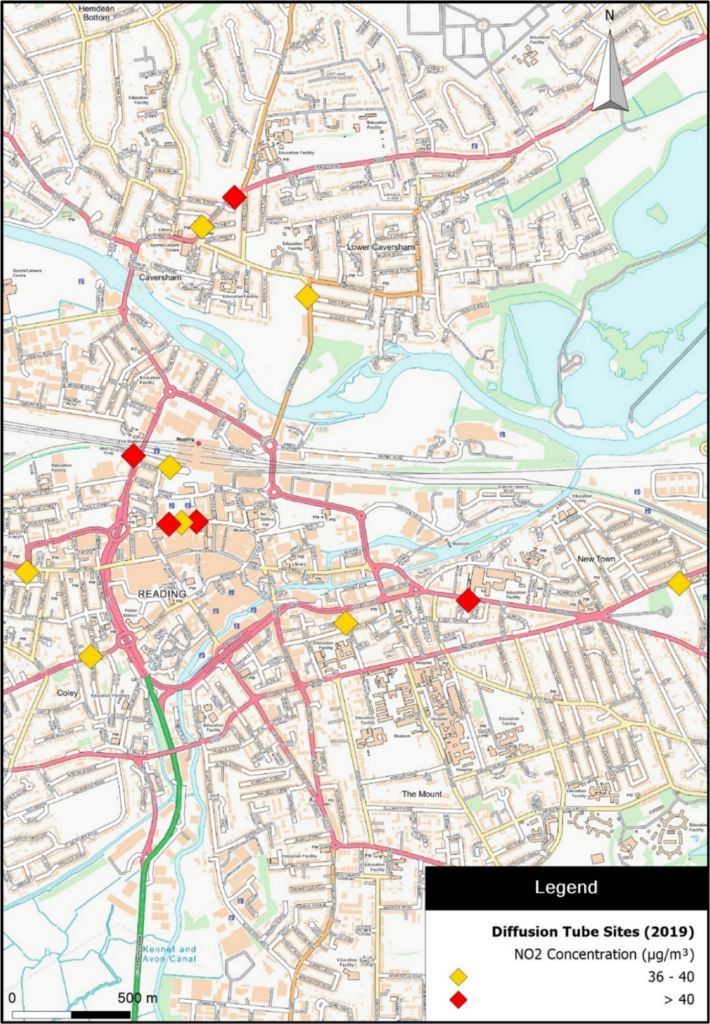
Monitoring results from the 2020 ASR for NO2, covering the 2019 data period, saw the number of non-compliant locations reduce to 5 from 15 locations (in 2018), with regard to the annual mean air quality objective (AQO). The data also identified a further 8 sites that were within 10% of the AQO risk threshold.
The key locations of non-compliance/ elevated concentrations in 2019 were:
- London Road
- Castle Hill
- Caversham Road/A329
- Caversham Road (A4155)
- Kings Road
- Prospect Street
- George Street
- Oxford Road
- Station Hill and Friar Street
No locations were in exceedance of the NO2 1-hour mean AQO and there were no exceedances of any AQOs for PM10. There was no exceedance of the 20 µg/m³ PM2.5 annual mean concentration target limit either.
Figure 2, below, displays the locations of diffusion tubes which were at least within 10% of the annual mean AQO for NO2 in 2019.
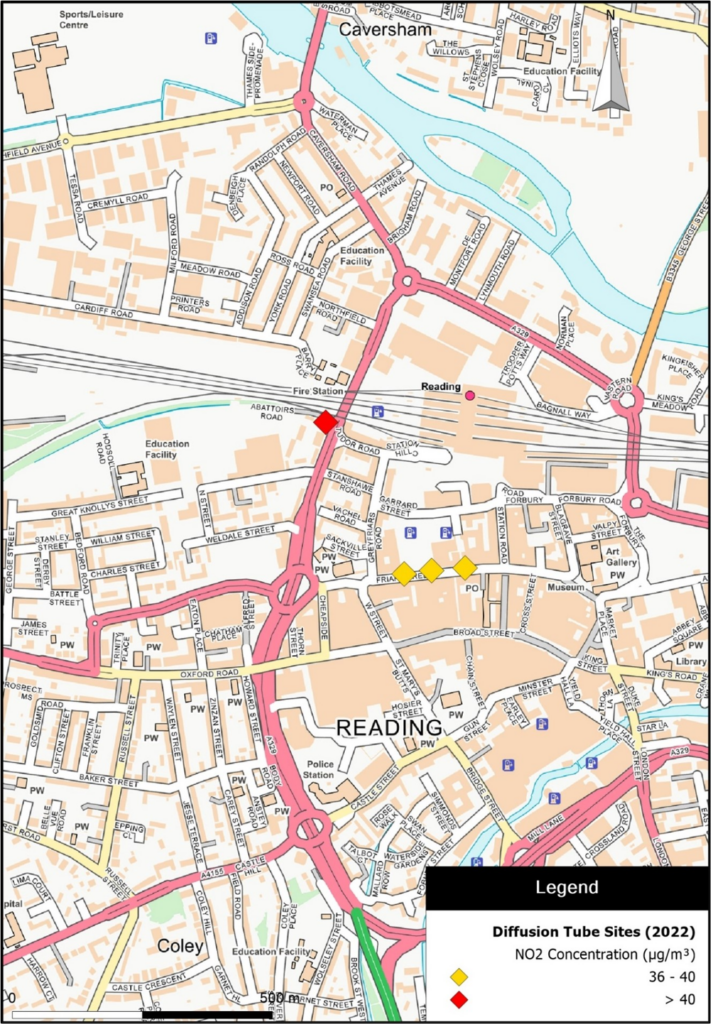
Monitoring results from the 2023 ASR for NO2, covering the 2022 data period, saw the number of non-compliant locations reduce to just 1 from the 5 locations in 2019, with regard to the annual mean air quality objective (AQO). The data also identified a further 3 diffusion tube sites that were within 10% of the AQO risk threshold.
The key locations of non-compliance/ elevated concentrations in 2022 were:
- Caversham Road/A329
- Friar Street
No locations were in exceedance of the NO2 1-hour mean AQO and there were no exceedances of any AQOs for PM10. There was no exceedance of the 20 µg/m³ PM2.5 annual mean concentration target limit either.
Figure 3, below, displays the locations of diffusion tubes which were at least within 10% of the annual mean AQO for NO2 in 2022.
2.2.2 Long term air quality trends in Reading
The influence of Covid-19
The reduction in annual mean NO2 exceedance areas between 2019 and 2022, as displayed in Figure 2 and Figure 3, suggests that air quality in Reading has improved over time.
It is acknowledged that the Covid-19 lockdowns and tiered restrictions impacted on our way of life and day to day activities, including; how and where we travelled, business operations, leisure activities and reduced use of public transport systems.
The associated lockdown periods showed how traffic influenced local pollution levels and signalled the level of reductions that could drive toward improved air quality. During the Covid-19 lockdown, levels of NO2 dropped by between 20-30% across the country[5] – primarily from a significant reduction in private vehicle use.
It is difficult to anticipate what the future impact on local and national pollutant emissions are likely to be in the wake of the pandemic. However, it is quite probable that 2022 represents the first year of a post pandemic era – a “new normal”. This AQAP shall be continually reviewed and will be updated, if necessary, as more post-pandemic data is gathered in the future.
Figure 4, below, shows monthly mean NO2 concentrations at Reading’s AURN urban background monitoring site, between 2017 and 2022. The data have been de-seasonalised and de-weathered using software packages available in R (v 4.3.1)[6] and Openair[7], to reduce the influence of seasonal variability and meteorology on the time series data. The subsequent trends seen in the data, after normalisation, better correlate with how air quality has actually changed over time.
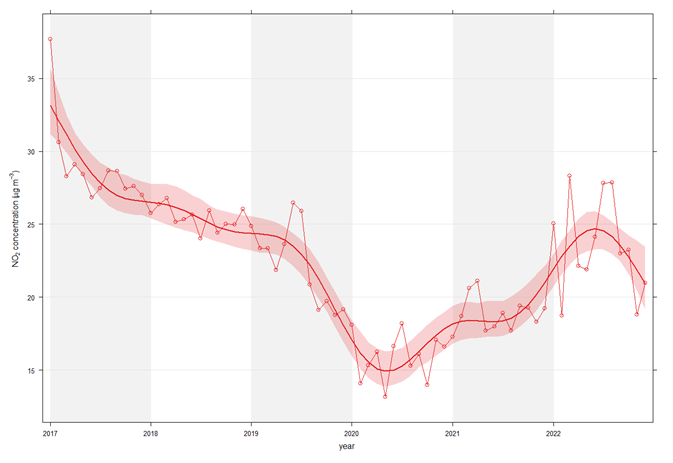
Figure 4 very clearly shows the influence of the Covid-19 pandemic on local air quality. The main local source of pollution within Reading is road transport emissions, and a Covid-19 study[8] undertaken on behalf of the Council strongly suggested that the key cause of this air quality improvement was the reduction in vehicle trips on the local road network.
Barring the brief plateau in NO2 concentrations at the time of the 2021 winter lockdown, concentrations have since increased to near pre-pandemic levels, likely due to the return of vehicles on the local road network.
NO2 trends within and outside of Reading’s IDR
Figure 5, below, displays trends in NO2 concentrations at all of Reading’s roadside monitoring sites (both AQMSs and diffusion tubes) between 2017 and 2022. Three coloured trend lines are also presented, representing the average (mean) trends for the monitoring sites in, on and outside of the IDR – these trend lines exclude monitoring data from 2020 and 2021, to limit the influence of the Covid-19 pandemic on the observed trends.
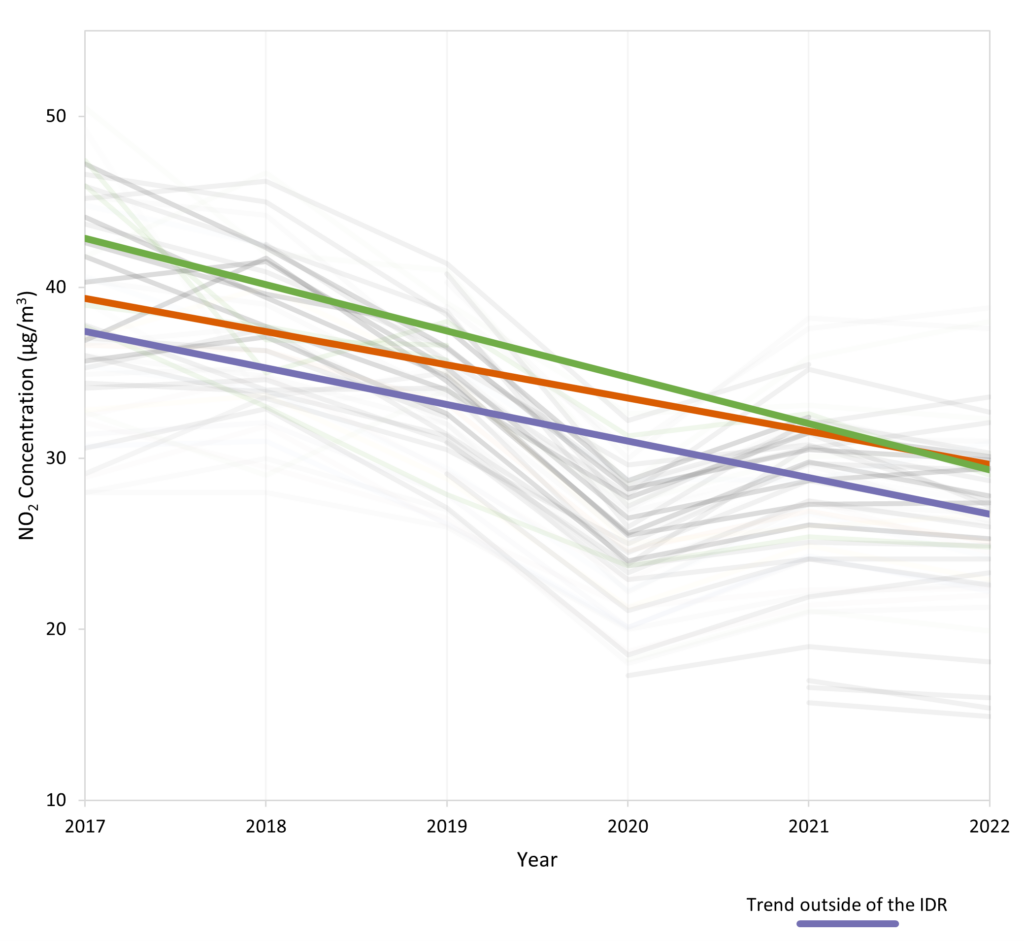
Evidently, air quality has improved significantly since 2017 with regards to NO2, even after discounting the influence of the pandemic on air quality trends.
The greatest rate of improvement has occurred at monitoring sites within the IDR, in Reading’s Town Centre. In 2017, the highest NO2 concentrations were identified in central Reading, but since then, concentrations have reduced at an average (mean) rate of 2.7 µg/m³ per year.
Concentrations outside of the IDR have consistently remained below those identified in central Reading, improving at an average rate of 2.1 µg/m³ per year.
At the few monitoring sites located directly on the IDR, NO2 concentrations have been improving since 2017, but at a slower rate of approximately 1.9 µg/m³ per year. Because of this, in 2022, annual mean roadside concentrations appear to be worse on the IDR than elsewhere in Reading, on average.
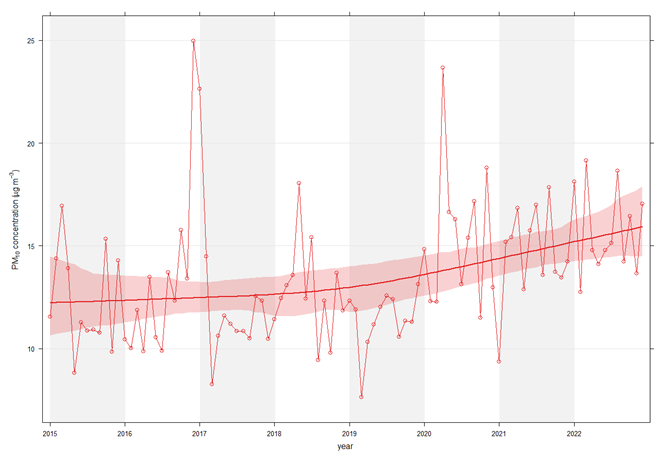
Long-term trends in Particulate Matter concentrations
The above data solely discusses trends with regards to NO2, the pollutant for which Reading’s AQMA was declared. However, increasing pressure is being placed on local authorities to consider how to manage particulate emissions within their boroughs.
As previously mentioned, concentrations of PM10 and PM2.5 have consistently remained well below the UK’s AQOs at all monitoring sites. Historically, PM10 concentrations have declined gradually over time. However, the rate of improvement has decreased since 2016, to such an extent that concentrations at Reading’s urban background AQMS have actually been on the rise in recent years.
This is demonstrated in Figure 6, below, which displays monthly mean de-seasonalised PM10 concentrations at the urban background AQMS. Although the rate of increase is very gradual, and concentrations remain well below AQOs, Reading Borough Council acknowledges the need to address the apparent worsening within its AQAP measures.
Regarding PM2.5, there is no clearly discernible trend in either direction, but it is apparent that PM2.5 concentrations are not improving. Again, although the rate of increase is very gradual, and concentrations remain well below AQOs, Reading Borough Council acknowledges the need to address the apparent worsening within its AQAP measures. For this reason, alongside increasing pressures from the Government for Local Authorities to reduce PM2.5 emissions across their boroughs, this AQAP places considerable weight to the consideration of measures to improve local PM concentrations. Measures to address PM10 should inherently address PM2.5 also, as the two are inextricably linked.
2.2.3 AQMA retention
The Reading AQMA is to be retained in its current form. The reasons for this are two-fold:
- Exceedances of the annual mean AQO for NO2 are still present within the existing AQMA boundaries; and
- Reading Borough Council are intent on producing an AQAP which targets air quality improvements across the entire borough, not just exceedance areas.
3. Reading Borough Council’s air quality priorities
3.1 Public health context
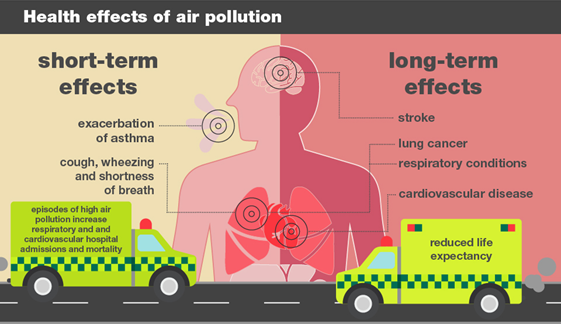
Poor air quality is the largest environmental risk to public health in the UK. Air pollution can cause, complicate, or exacerbate many adverse health conditions. It usually manifests in respiratory or cardiac symptoms and can lead to chronic health issues. Recent studies show that poor air quality can affect every organ in the body and even cause damage to cognitive performance. Exposure to poor air quality is directly related to diseases such as cancer, asthma, strokes, heart disease, diabetes, obesity and dementia.
Health effects of pollutants can impact on people’s health in the short-term or long term, as shown in Figure 7[9].
According to the World Health Organisation (WHO), air pollution is associated with 7 million premature deaths worldwide every year, of which 4.2 million are attributed to exposure to outdoor air pollution. The WHO estimate that 99% of people in the world breathe air containing health impacting levels of air pollutants[10]. With this in mind, and despite some emphasis being placed on reducing emissions on Reading’s IDR (where air quality is poorest), several actions listed within this AQAP to improve air quality have been designed to improve on the current situation across the whole of the borough.
3.1.1 Health inequalities
Air pollution can affect people from different ethnicities, ages, and social groups. It is likely to have greater impacts on those who experience high amounts of exposure and those who have greater susceptibility. The most vulnerable are those with pre-existing health conditions, children, or the elderly.
Several studies are also showing a strong correlation between poor air quality and inequality issues. A 2019[11] research study, led by academics at the Air Quality Management Resource Centre at the University of the West of England, Bristol, found that social inequalities in traffic-related pollution exposure are ‘clearer and stronger’ than ever before. The study found that while young children, young adults, and households in poverty have the highest levels of exposure to air pollution, it is the richer households who are more responsible for it. In December 2020, Ella Adoo-Kissi-Debrah became the first person to officially have air pollution listed as a cause of death on her death certificate. Ella lived near a major circular road in southeast London and died in 2013 when she was 9 years old. At the inquiry into Ella’s death, the coroner Philip Barlow cited that;
“Air pollution was a significant contributory factor to both the induction and exacerbation of her asthma” and “that the cumulative effect of continuously breathing in toxic air caused her fatal asthma attack”.
A recent study from the Office for National Statistics[12] also shows a strong positive correlation between the proportion of population in the UK that falls into the Black, Asian and Minority Ethnicity (BAME) category and the exposure of NO2 measured over a period of 10 years across several areas in England.
Reading’s Public Health department not only aims to improve health, but also reduce health inequalities by using an evidence-based approach to make recommendations on the delivery of health and wellbeing services. As such, this Action Plan will support work underway within the public health arena.
3.2 Planning and policy context
3.2.1 National policy
National Planning Policy Framework
The National Planning Policy Framework (NPPF)[13], which was revised in July 2021, sets out the Government’s planning policy for England. At its heart is an intention to promote more sustainable development. The planning system should play an active role in guiding development to sustainable solutions and air quality is a material planning consideration.
A core principle in the NPPF that relates to air quality effects from development is that planning should “contribute to conserve and enhance the natural and local environment”. In achieving this, it states in paragraph 174 that:
“Planning policies and decisions should contribute to and enhance the natural and local environment by: […]
preventing new and existing development from contributing to or being put at unacceptable risk from, or being adversely affected by unacceptable levels of soil, air, water or noise pollution or land instability. Development should, wherever possible, help to improve local environmental conditions such as air and water quality […]”.
Regarding compliance with relevant limit values and national objectives for pollutants the NPPF, paragraph 186 states:
“Planning policies and decisions should sustain and contribute towards compliance with relevant limit values or national objectives for pollutants, taking into account the presence of Air Quality Management Areas and Clean Air Zones, and the cumulative impacts from individual sites in local areas. Opportunities to improve air quality or mitigate impacts should be identified, such as through traffic and travel management, and green infrastructure provision and enhancement. So far as possible these opportunities should be considered at the plan-making stage, to ensure a strategic approach and limit the need for issues to be reconsidered when determining individual applications. Planning decisions should ensure that any new development in Air Quality Management Areas and Clean Air Zones is consistent with the local air quality action plan.”
Climate change and decarbonisation
The UK Government has committed to cutting greenhouse gas emissions by at least 68 percent by 2030 and is to end support for the fossil fuel sector overseas. Commitments to cutting greenhouse gas emissions will also benefit local air quality by bringing forward plans for decarbonising various sectors including transport, as well as industry, energy and domestic sources of emissions.
The Climate Change Act 2008 sets up a framework for the UK to achieve its long-term goals of reducing greenhouse gas emissions and to ensure steps are taken towards adapting to the impact of climate change. The Act saw the UK tasked with reducing emissions by at least 80% by 2050.
The government set out it’s “Road to Zero” Strategy[14] for cleaning up road transport emission and published the Transport Decarbonisation Plan (TDP) Decarbonising transport: a better, greener Britain[15] in July 2021. The TDP outlines the Government’s current position on transport emissions, including highlighting current policies and strategies in place to decarbonise the transport sector. The TDP sets out to ban the sale of diesel and petrol cars and light goods vehicles from 2030, followed by the requirement for all new cars and vans to be fully zero emission at the tailpipe by 2035. Additionally, the Government have published a consultation on ending the sale of all non-zero emission Heavy Goods Vehicles (HGVs) from 2040, with lighter HGVs from 2035[16].
Statutory obligations to reduce PM2.5
PM2.5 is becoming more focal to the UK’s air quality ambitions. In 2019, the UK’s Clean Air Strategy[17] proposed the introduction of new, ambitious, long-term air quality targets for PM2.5. In 2021, the Environment Bill[18] committed the Secretary of State to setting new Air Quality Objectives for PM2.5.
Subsequently, the 2023 Air Quality Strategy[19] stipulates two new legally-binding long-term targets to reduce concentrations of fine particulate matter, PM2.5. The two new targets are an annual mean concentration of 10 μg/m3 or below and a reduction in average population exposure by 35% by 2040, compared to a 2018 baseline. These targets will help drive reductions in the worst PM2.5 hotspots across the country, whilst ensuring nationwide action to improve air quality for everyone.
The Environmental Improvement Plan 2023[20], which supplements the Air Quality Strategy, sets out the delivery plan to achieve the targeted pollutant reductions, which has been reviewed accordingly during the production of this AQAP. The Improvement Plan also sets an additional interim long-term target for PM2.5, of 12 μg/m3, to be achieved by January 2028.
The Government’s Air Quality Strategy stipulates that all local authorities must take sufficient action to reduce PM2.5 emissions from sources within their control. In circumstances where the extent of measures from local authorities are deemed insufficient, the Government will consider implementing statutory duties on local authorities. Reading can confirm that PM2.5 has been given considerable weight throughout this AQAP.
Reading acknowledges that the Environment Bill, Air Quality Strategy and Environmental Improvement Plan target reductions in all pollutants, not solely PM2.5. The measures set out within this Action Plan are designed to reduce emissions of several key pollutants, across all sectors within the control of the Council.
Along with the commitment to set targets on air quality for the UK, the new Bill also promises the creation of a new independent Office for Environmental Protection to scrutinise environmental policy and law, investigate complaints, and take enforcement action against public authorities, if necessary, to uphold current and future environmental standards.
3.2.2 Local policy
Reading has key plans, strategies, and policies that the AQAP will compliment and support.
Reading Local Plan
The Reading Local Plan[21] guides development in Reading up to 2036 and will therefore play a key role in how the town evolves, with core objectives for sustainable growth. The Local Plan seeks to deliver new homes and employment space in Reading, alongside critical infrastructure to accommodate forecast housing demands and job creation, and to ensure the town remains an attractive place to work, live and study.
Local Plan Policy EN15: Air Quality is of direct relevance to air pollution in the planning context:
“Development should have regard to the need to improve air quality and reduce the effects of poor air quality.
i. Development that would detrimentally affect air quality will not be permitted unless the effect is to be mitigated. The following criteria should be taken into account:
- Whether the proposal, including when combined with the cumulative effect of other developments already permitted, would worsen air quality;
- Whether the development is within, or accessed via, an Air Quality Management Area; and
- Whether it can be demonstrated that a local worsening in air quality that would not detrimentally affect human health or the environment would be offset by an overall improvement in air quality, for instance through reduction in the need to travel.
ii. Where a development would introduce sensitive uses (such as residential, schools and nurseries, hospitals, care facilities) into, or intensify such uses within, an Air Quality Management Area, detrimental effects on that use will be mitigated. Mitigation measures should be detailed in any planning application. If there are significant detrimental effects that cannot be mitigated, the application should be refused.
iii. Where required, planning obligations will be used to secure contributions to measures to tackle poor air quality or for air quality monitoring.”
This policy aims to ensure that increased development within Reading does not lead to a net increase in emissions as well as ensuring any increased exposure within the poorest areas of air quality is accompanied by appropriate mitigation.
In addition to this are several policies of indirect relevance to air quality, including:
- CC3: Adaption to Climate Change
- TR1: Achieving the Transport Strategy
- TR2: Major Transport Projects
- TR4: Cycle Routes and Facilities; and
- TR5: Car and Cycle Parking and Electric Vehicle Charging.
Reading 2050 Vision
The Reading 2050 Vision is an ambitious description of what Reading can be, with three themes central to Reading’s long-term success as a smart and sustainable city. These three themes are:
- A green tech city
- A city of culture and diversity
- A city of rivers and parks
The report envisages a place where low carbon living will be the norm, and where the built environment, technology and innovation have combined to create a smart, dynamic and sustainable city, with a high quality of life and equal opportunity for all.
Climate Emergency Declaration and Strategy 2020-2025
Reading Borough Council declared a climate emergency in February 2019 which highlighted its commitment to playing a full role and leading by example in achieving a carbon neutral Reading by 2030. The Reading Climate Emergency Strategy 2020-25 sets out the actions required during the five-year period to work towards the objective of a net zero carbon Reading by 2030, the target adopted in the climate emergency declaration. There are several actions within the strategy that will help drive down local emissions:
- T13: Develop a zero-emission vehicle strategy for the borough
- T14: Decarbonise the Council Vehicle Fleet
- T15: Increase Public Electric Vehicle Charging Points
- T16: Increase Zero Emission Vehicles Uptake
- T18: Planning Policy for EV Charging in new properties
- T19: Reduce emissions from the Taxi Fleet; and
- T20: Improve Electric Vehicle Charging Infrastructure
Reading Transport Strategy 2040 (Local Transport Plan)
As demonstrated in Chapter 2 of this AQAP, nitrogen dioxide concentrations have generally improved across Reading in recent years. Nonetheless, some areas of Central Reading are still in, or close to, exceedance of legal objectives, specifically at locations close to busy and congested roads. Many of Reading Borough Council’s actions therefore revolve around improvements to Reading’s local transport network.
The Reading Transport Strategy will help to deliver both the Reading 2050 and Reading Local Plan visions, through an ambitious programme of measures to enable and encourage sustainable travel choices in the town by 2040, with the intent that future transport strategies will continue to support the Reading 2050 vision in the longer term.
Strategic objectives have been developed (see Figure 8, below) as the guiding principles running through this strategy to ensure and set out how Reading will measure success in delivering the vision for transport in Reading.
Figure 8: Reading Transport Strategy Objectives
 Creating a clean and green Reading
Provide transport options to enhance a quality of life, reduce emissions and improve air quality to create a carbon neutral town.
 Supporting Healthy Lifestyles
Create healthy streets to encourage active travel and lifestyles, improve accessibility to key destinations and increase personal safety.
 Enabling Sustainable and Inclusive Growth
Enable sustainable growth and connect communities so that everyone can benefit from Reading’s success.
 Connecting People and Places
Promote the use of sustainable modes of transport by providing attractive alternatives to the private car, helping to provide a transport network that is fast, affordable, connected and resilient.
 Embracing, Smart Solutions
Use technology to manage the network efficiently and allow informed travel choices, whilst enabling Reading to become a smart connected town of the future.
The Local Transport Strategy sets out 32 strategic policies and proposes over 40 schemes and initiatives to achieve the above objectives. Most of these prospective schemes and initiatives will offer benefits to local air quality, at least indirectly. Some of these initiatives are discussed in further detail within Section 5 of this AQAP.
Carbon Plan 2020-25
The Carbon Plan sets out policy and targets on corporate energy and water management and identifies actions to achieve these within the time period 2020-2025. The plan includes actions which relate to reducing and decarbonising Reading’s own buildings and services, including transport which accounts for 15% of CO2 emissions (2018/19) for the authority.
Berkshire West Health and Wellbeing Strategy 2021-2030
Reading’s Health and Wellbeing Strategy sets out the areas the Council will focus on to improve and protect the health and wellbeing of people who live in Reading and those who visit. The strategy and associated action plan cover a wide range of topics, including a vision that all residents will benefit from a healthy environment, a ‘Health in All Policies’ approach to reduce health inequalities, the benefit to mental and physical health of increased physical activity levels through active travel and a recognition of the benefits of greater social connectedness through improved access to transport.
Corporate Plan
The Corporate Plan sets out how the Council will enable Reading to realise its full potential and ensure that everyone who lives and works in Reading can share the benefits of its success.
The Council has listened to what residents, businesses and partners have said about their experience of Reading, and their hopes and aspirations for the town. In this year’s residents survey, the Council heard that residents are satisfied with how it runs services in Reading but would like to see more action taken on affordable housing, levels of crime, road conditions, congestion and climate change. Through public consultation on major change initiatives – such as the new Local Transport Plan and the Climate Emergency Strategy – the Council knows it has the support of residents and partners to make the required changes. The Council will drive the necessary change in Reading by focussing on the following three themes:
- Healthy environment
- Thriving communities
- Inclusive economy
3.3 Source apportionment
The AQAP measures presented in this report are intended to be targeted towards the predominant sources of emissions within Reading Borough Council’s administrative area.
A source apportionment exercise was carried out by Reading Borough Council in 2023, using data from 2022/ 2023 (post-Covid), where possible.
The influence of Covid-19 on air quality
We appreciate that Covid-19 has had a substantial influence on air quality across the UK (see Figure 4) and there is still uncertainty regarding how long-lasting some of its effects could be. It is widely accepted that one of the key influences for the improved air quality conditions observed during the pandemic was a reduction in vehicle flows. The Department for Transport (DfT) has provided regional traffic statistics for the borough of Reading[22], which have been used to demonstrate how the number of vehicle trips has changed during and since the pandemic, as shown in Figure 9.
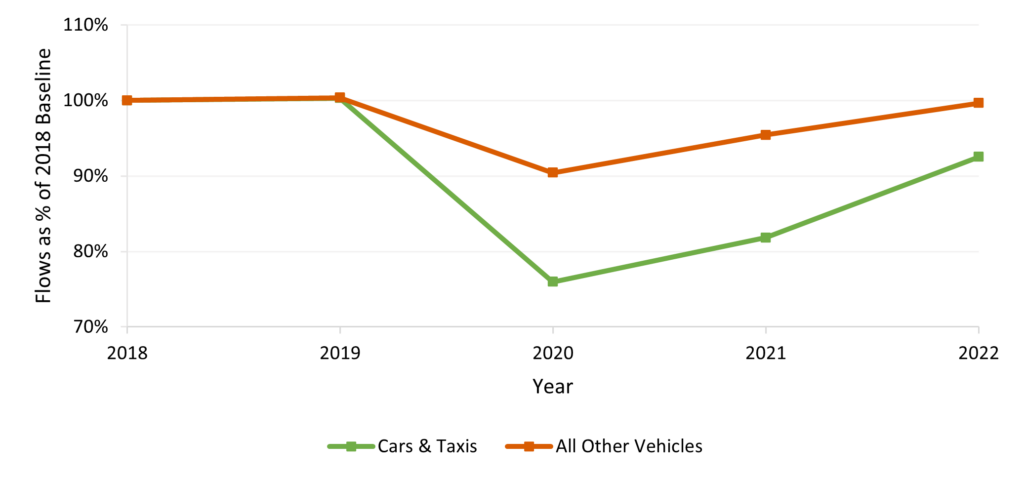
The data clearly demonstrates that the pandemic had a disproportionately greater effect on car trips than on trips made by other vehicles (light goods vehicles, heavy goods vehicles and buses). In 2022, trips by other vehicles returned to pre-Covid levels. Car and taxi trips have increased but remain considerably below pre-Covid levels, which could explain why air quality was considerably better in 2022, than 2019. Whether car trip volumes will continue to increase, or whether the pandemic will have long-lasting effects on travel behaviours (e.g. a permanence to ‘working from home’ trends), will become apparent in future years. In the unlikely event that air quality worsens in subsequent years, this source apportionment exercise should be reviewed to determine whether any associated conclusions remain relevant.
Sources of pollution
Pollutants can arise from an amalgamation of local sources, as well as sources imported from other regions, cities (e.g. London) and land masses (e.g. Europe). Vehicle emissions will arise from the combustion of fossil fuels in vehicle engines and their subsequent release to atmosphere via tailpipe exhausts. The most significant pollutants released by cars and other vehicles are oxides of nitrogen (NOx) and particulate matter (PM10 and PM2.5).
Other (background) sources might include emissions from commercial operations, domestic heating, industry, energy production, airports and railways, or even from secondary chemical reactions in the atmosphere.
3.3.1 Nitrogen Oxides (NOX)
A source apportionment study provides information on the sources of pollutants, to assist in identifying which sectors should be targeted to deliver the most effective emissions reduction strategy to deliver compliance with Air Quality Objectives. As discussed in Section 2.2.1, most of Reading is currently compliant with all Air Quality Objectives, but there remain some areas where NO2 concentrations are unacceptably high.
Transport is responsible for more than two thirds of all NOX emissions and accounts for a significant proportion (around 10% or more) of the total emissions of other pollutants. Road transport, in particular, continues to account for a significant proportion of emissions of all the main air pollutants.
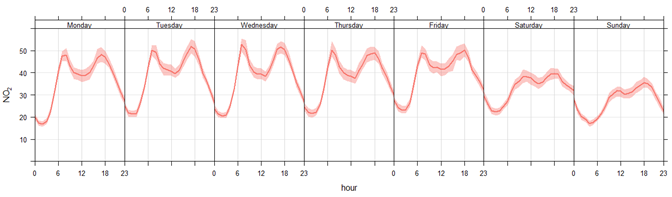
Figure 10, below, displays the average weekly temporal variability in NO2 concentrations at Reading’s RD1 Automatic Monitor, located adjacent to the A329 Caversham Road, throughout 2022. The data highlights significant NO2 peaks specifically during the morning and evening ‘rush-hour’ periods from Monday to Friday. This corroborates our understanding that road transport emissions are a substantial source of NOX pollution near Reading’s arterial road network.
Concentrations reduce at the weekends, likely due to an overall reduction in vehicle movements. This is a trend that was comparably identifiable before the Covid-19 pandemic.
NOX Source Apportionment
Acknowledging the above evidence, the NOX source apportionment focuses on the local vehicle fleet. Traffic data were obtained from the DfT and Reading Borough Council’s own traffic count data, and fleet emissions data were obtained from Defra’s latest Emissions Factor Toolkit (EFT v11.0) and Reading’s own bus fleet data. Locations with both suitable traffic data and monitoring data were used for analysis.
According to manually counted traffic data, cars, taxis and light good vehicles (LGVs) comprise over 90% of all vehicle trips on almost all of Reading’s road network.
As such, it is no surprise that the bulk of traffic emissions at roadside locations are from cars, taxis and LGVs. Figure 11 shows that of the 66% of NOX concentration attributable to vehicle traffic, 39% is attributable to cars (primarily diesel cars), 7% to diesel LGVs, 18% to HGVs and 1% to buses.
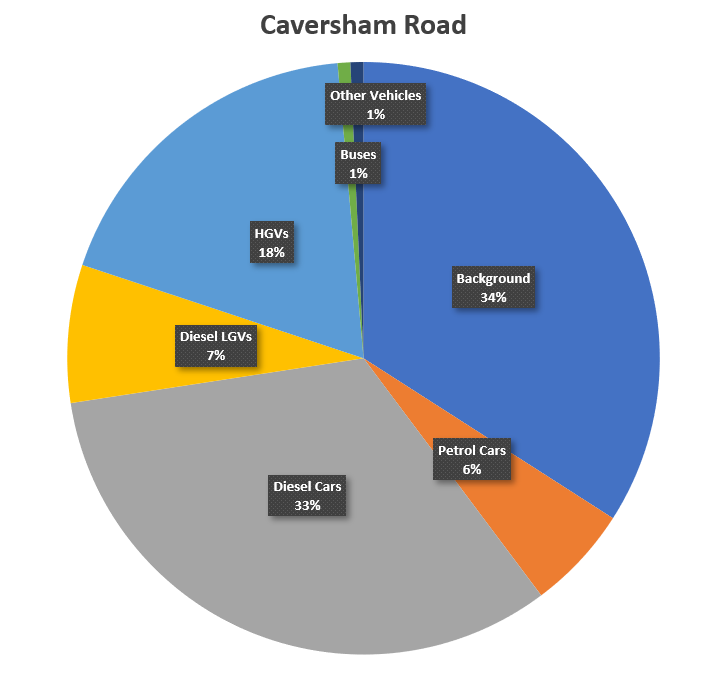
For context, at the Caversham Road diffusion tube (the only AQO exceedance location in 2022), where an NO2 concentration of 43.3 µg/m3 was recorded, almost 17 µg/m3 of the annual mean concentration arises from car traffic, approximately 3 µg/m3 from diesel LGVs, 8 µg/m3 from HGVs and approximately 0.3 µg/m3 from buses.
According to the above data, the key issue from an air quality perspective is associated with the volume of diesel cars on the road network. Therefore, any measures to reduce the number of diesel car trips and associated congestion issues are likely to enable air quality improvements and encourage Reading towards being fully compliant with all Air Quality Objectives.
HGV emissions are also a considerable contributor to local air pollution at this location. Reading’s Transport Strategy acknowledges that a uniquely large proportion of vehicle trips along Reading’s IDR are HGVs, likely due to the convenience of this road network for cross-Thames travel. At other locations across Reading, such as B3345 George Street and A4155 Castle Hill, the contribution of HGVs to local NOX concentrations is over 10% less than the contribution of HGVs on the IDR.
It is worth acknowledging that approximately a third of NOX concentrations are generated from non-vehicular sources. Defra provides estimated background concentrations of the UKAQS pollutants at the UK Air Information Resource (UK-AIR) website[23]. These estimates are produced using detailed modelling tools and are presented as concentrations at central 1km2 National Grid square locations across the UK. UK-AIR estimates that approximately 6% of NOX is generated from domestic, institutional or commercial combustion heating, with a similar proportion generated from railway freight movements. The majority of background emissions are from regional rural sources.
It is acknowledged that Defra’s UK-AIR background data is collected for 1km2 grid squares, so is not necessarily site specific. In the case of the Caversham Road diffusion tube, the estimate background concentration is likely to be close to this value, but the tube’s proximity to the railway means the proportion of railway freight emissions could be slightly higher than the estimated value. Reading Borough Council are intent on investigating the air quality impacts of Reading’s railways further in the coming years.
3.3.2 Particulate matter
Exhaust emissions and brake and tyre wear are likely to constitute a notable proportion of PM emissions (potentially up to 20%) close to Reading’s arterial road network, so measures to reduce vehicular NOX emissions should inherently help enable PM reductions also.
However, unlike NOX, a considerable proportion of PM is produced from non-vehicular sources. Defra’s UK-AIR estimates that approximately 20% of Reading’s PM2.5 concentrations are from naturally occurring sources (e.g. sea spray and pollen), almost 20% is from domestic, institutional or commercial combustion heating, and the vast majority is from transboundary sources (i.e. Europe) or formed through secondary reactions in the atmosphere.
The notion that the primary sources of PM differ to those of NOx is corroborated by comparing Figure 4 to Figure 6, where long term trends in NO2 concentrations differ to that of PM.
One possible cause of the recent plateauing of PM concentrations (increases, in some cases) is from recent increases in domestic solid fuel burning. Since 2011, Defra estimates that PM2.5 emissions from domestic wood burning have increased by over 124%, with a recent UK-wide survey identifying that 1 in 13 homes burned wood[24]. Public Health England approximate that solid fuel burning could now account for over 30% of local PM emissions[25].
Temporal variability in PM concentrations at Reading’s urban background automatic monitor show regular peaks in the evenings, which are exacerbated in winter and at weekends (see Figure 12, below). Given the ‘sharpness’ of this peak, its prominence compared to the same peak in summer months, and the fact that the peak continues well beyond the weekday afternoon traffic ‘rush-hour’, the source of the peak is likely to be arising at least partly from localised domestic and commercial solid fuel combustion sources.
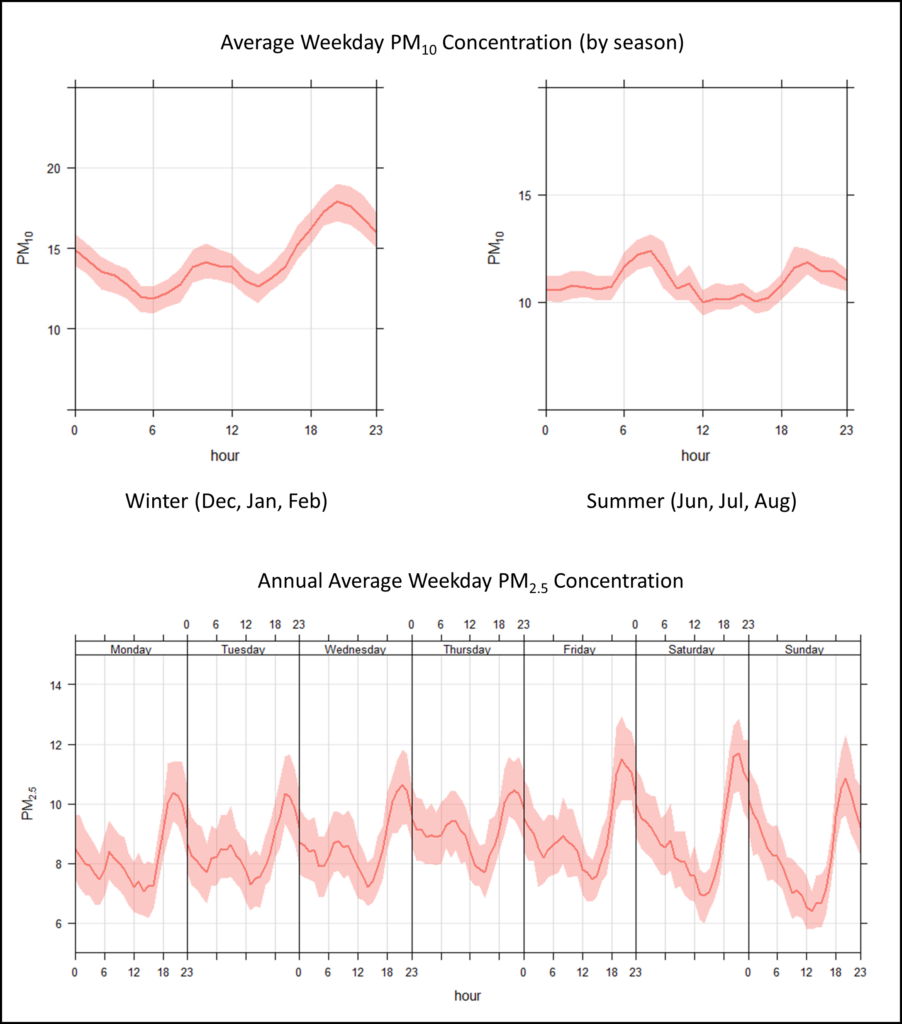
As such, Reading Borough Council intend to place considerable weight to reducing this emission source.
3.4 Required reduction in emissions
Within Reading, there is currently one location identified as being in exceedance of any of the legal UK Air Quality Objectives. This is at Diffusion Tube #43, on Caversham Road, where a 2022 annual mean NO2 concentration of 43.3 µg/m3 was recorded, 8.25% above the annual mean AQS.
Following the calculation processes prescribed in LAQM.TG(22)[26], a road NOX concentration reduction of over 7.61 µg/m3 would be required to achieve compliance at this location, which represents a 15% reduction in road NOX emissions.
3.5 Key priorities
AQAP policy options will include direct policy interventions, infrastructure schemes, education or enabling options, to support Readings ambitious plans and UK strategies going forward. As such, policy options will include strategies to encourage or accelerate the uptake of low to zero emission vehicles, non-diesel vehicles, increase modal shift and discourage vehicle usage in certain areas where people live or go to school. Active travel and health options are also prioritised in the AQAP, alongside measures to reduce particulate matter concentrations.
As based on the conclusions of the above, the areas prioritised for action include:
- Priority 1 – reduce road NOX & PM emissions throughout Reading, with emphasis placed on reducing emissions on Reading’s Inner Distribution Road (IDR);
- Priority 2 – reduce exposures of individuals and locations where vulnerable people (children, elderly and those with cardiovascular disease) live, work or visit;
- Priority 3 – encourage, enable and support people and businesses to shift from high polluting to zero emission transport or energy options;
- Priority 4 – inform and educate people on the financial, environmental and health benefits of active travel, modal shift and reducing emissions through our daily lives;
- Priority 5 – inform, educate and enforce compliance (where necessary) on domestic wood burning regulations, to reduce local PM2.5 emissions; and
- Priority 6 – improve our monitoring network and planning requirements to support other projects and ensure new developments align with the aims of this AQAP.
4 Development and implementation of Reading Borough Council’s AQAP
4.1 Consultation and stakeholder engagement
In developing/updating this AQAP, we have worked with other local authorities, agencies, businesses and the local community to improve local air quality. Schedule 11 of the Environment Act 1995 requires local authorities to consult the bodies listed in Table 4.1.In addition, we have undertaken the following stakeholder engagement:
- Public Consultation
- Website
- Social Media
- Etc.>
The response to our consultation stakeholder engagement is given in Appendix A: Response to Consultation.
| Consultee | Consultation undertaken |
|---|---|
| The Secretary of State | <Yes/No> |
| The Environment Agency | <Yes/No> |
| The Highways Authority | <Yes/No> |
| All neighbouring local authorities | <Yes/No> |
| Other public authorities as appropriate, such as public health officials | <Yes/No> |
| Bodies representing local business interests and other organisations as appropriate | <Yes/No> |
4.2 Steering Group
Reading Council established an internal Air Quality Steering Group (AQSG) in 2020 to develop and evaluate the draft AQAP measures. When the work was recommenced on the AQAP in 2023 some of the officers had changed, this is signified by the year in brackets after each name in the below list.
The AQSG was composed of Reading Council members and officers:
- Former Deputy Leader of the Council: Cllr Tony Page (2020).
- Former Chair of Strategic Environment, Planning and Transport Committee: Cllr Paul Gittings (2020).
- Former Deputy Director of Planning, Transport and Regulatory Services: Giorgio Framalicco (2020).
- Regulatory Services – Principal Air Quality Project Officer: Ross Jarvis (2020, 2023).
- Assistant Director, Planning, Transport & Public Protection: James Crosbie (2023).
- Regulatory Services – Public Protection Manager: Matt Golledge (2023).
- Regulatory Services – Community Protection Manager: Catherine Lewis (2020, 2023).
- Public Health and Wellbeing Team – Public Health Consultant Martin White (2023).
- Transport – Transport Programme Manager: Chris Maddocks (2020, 2023).
- Transport – Project Manager: James Clements (2020, 2023).
- Transport – Senior Transport Planner: James Turner (2020, 2023).
- Head of Climate Strategy: Peter Moore (2020, 2023).
- Sustainability Manager: Ben Burfoot (2020, 2023).
- Public Health: David Munday (2020).
- Planning – Planning Policy Manager: Mark Worringham (2023).
- Planning – Senior Planning Policy Officer: Sarah Burr (2023).
5 AQAP measures
Table 5.1, Table 5.2 and Table 5.3 shows the Reading Borough Council AQAP measures. It contains:
- a list of the actions that form part of the plan
- the responsible individual and departments/organisations who will deliver this action
- estimated cost of implementing each action (overall cost and cost to the local authority)
- expected benefit in terms of pollutant emission and/or concentration reduction
- the timescale for implementation
- how progress will be monitored
NB: Please see future ASRs for regular annual updates on implementation of these measures.
5.1 Travel measures
Reading Borough Council are committed to implementing as many measures as possible to encourage and facilitate a shift from private petrol/ diesel vehicle use to more active and sustainable travel modes.
Reading’s Transport Strategy 2040 discusses an abundance of ambitious schemes and initiatives to achieve this goal, which will inherently allow for significant improvements in air quality across the borough.
A few examples of proposed measures are listed below:
- Cross-Thames Travel: there is potential for a new road crossing over the Thames, to support in the alleviation of congestion on the IDR. Reduced congestion on the IDR will better enable multi-modal enhancements on the IDR, which will aim to support active travel and prioritise bus transportation.
- Reading’s bus fleet is one of the cleanest emitters in the country, with approximately 100% of the fleet comprising hybrid, gas or Euro 6 diesel vehicles. With this in mind, Reading Borough Council are placing heavy emphasis on improving the attractiveness and accessibility of bus travel across Reading. To this end, they are proposing the following measures:
- Enable more direct routes between neighbourhoods with poor bus use statistics, key mobility hubs and employment areas;
- Introduction of Bus Rapid Transit (BRT) facilities across four key routes and expansion of Park and Ride sites, connecting the outskirts of the borough to Central Reading via highly efficient transport modes.
- Introduce a Mobility as a Service (MaaS) scheme, which would enable travellers to reach destinations confidently and conveniently, without the need for private vehicles, utilising a user-friendly transport services mobile app; and
- Offer discounted fares for young people to discourage private vehicle school trips, which account for approximately 25% of ‘rush-hour’ car trips.
- In 2020, taxi licensing fees were reduced by 25% for drivers of ultra-low emission vehicles, and 50% for drivers of electric vehicles. By 2028, Reading is targeting for all taxis to be electric or ultra-low emission vehicles.
- Cycle infrastructure improvements are being delivered through Active Travel Schemes on the Shinfield Road and on the Bath Road/Castle Hill. Further schemes are planned for future Active Travel Funding rounds.
5.2 Other measures
It cannot be argued that targeting measures to improve the transport sector’s environmental impacts, such as those listed above, will have the most significant contributions to local air quality improvements, especially with regards to NO2. However, there are a considerable number of alternative measures which can also allow for such benefits, especially with regards to reducing other pollutants, such as PM2.5.
A few examples of proposed measures are listed below:
- In the coming years, Reading proposes to introduce planning guidance for new developments, supporting developers to minimise the air quality impacts of developments through strategic emissions mitigation plans.
- Reading Borough Council have recently consulted on the prospect of expanding Reading’s existing Smoke Control Area (04/09/2023 – 16/10/2023) to encompass the entire borough. Properties and business within Smoke Control Areas are encouraged to avoid the burning of solid fuels (i.e. wood and coal) through chimneys. Legal prohibitions are based on specific fuel types associated with significant smoke generation, limiting fuel sales and purchases to ‘Ready to Burn’ / ‘Smokeless’ fuels, unless alternatives are burned within Defra exempt appliances. Reading Borough Council are also obtaining funding to enable the introduction of better enforcement measures to ensure better compliance with fuel burning regulations.
- There is also significant value in providing the public with sufficient information to enable them to make informed decisions on matters of health and air quality. To this end, Reading Borough Council are committed to providing several air quality resources to the public, such as:
- Air Alert – air quality alerts are delivered to the public via text or email on days where pollution levels are recorded as being particularly high and potentially harmful to health;
- The council will work with GPs and Health Practitioners to better educate health patients on the risks of air quality, especially where the patient is identified as having, or being at risk of having, respiratory or cardiovascular illnesses;
- Air quality awareness campaigns will continue to be rolled out into schools, to encourage an interest and understanding of the potential issues and solutions from an early age; and
- Resources will be made available to Reading’s residents, enabling them to better understand the potential air quality impacts of wood burning/ bonfires/ indoor air quality.
| Measure No. | Measure | Category | Classification | Estimated Year Measure to be Introduced | Estimated / Actual Completion Year | Organisations Involved | Funding Source | Defra AQ Grant Funding | Funding Status | Estimated Cost of Measure | Measure Status | Target Reduction in Pollutant / Emission from Measure | Key Performance Indicator | Progress to Date | Comments / Potential Barriers to Implementation |
| RDAQ1_Transport | Vehicle access/ speed management (road/ bridge access) | Traffic management | Reduction of speed limits, 20mph zones | 2023 | TBC | RBC | RBC/DFT | No | Funded/partially funded/ not funded | <£1m | Implementation/Planning | Minor Localised benefits to PM; Smoother driving leading to a reduction of PM from tyre and brake wear | No. of roads made 20mph | ||
| RDAQ2_Transport | Parking standards – diesel/ EV differential parking rates | Traffic Management | Emission based parking or permit charges | 2024 | 2024 | RBC | RBC | No | Not funded | < £10k | Planning | Minor Regional benefits to NO2 and PM; encourages uptake of cleaner vehicles | |||
| RDAQ3_Transport | Reading Buses investment programme and support | Vehicle Fleet Efficiency | Public Transport Improvement | 2023 | 2027 | RBC/Reading Buses | Defra/ JAQU/DFT | Yes | 1m-10m | Planning | Moderate Regional benefits to NO2 and PM; reduces bus emissions | Buses decarbonised | ZEBRA funding bid being prepared | ||
| RDAQ4_Transport | Neighbourhood and Highway Management | Traffic Management | UTC, Congestion management, traffic reduction | 2024 | 2028 | RBC | RBC/DFT | No | Not funded | < £10k | Planning | Minor Localised benefits to NO2 and PM | |||
| RDAQ5_Transport | Implementation of EV Infrastructure Strategy | Promoting Low Emission Transport | Procuring alternative Refuelling infrastructure to promote Low Emission Vehicles, EV recharging, Gas fuel recharging | 2024 | 2025 | RBC | No | Not funded | £10k – £50k | Implementation | Moderate Regional benefits to NO2 and PM; facilitating and encouraging EV vehicle uptake rates | Policy adoption | |||
| RDAQ6_Transport | Improve taxi fleet emissions | Promoting low emission transport | Taxi licensing conditions | 2024 | 2028 | RBC | RBC | No | Not funded | £10k – £20k | Planning | Minor Regional benefits to NO2 and PM; reduces taxi emissions | Emissions policy in place for hackney fleet | ||
| RDAQ7_Transport | School Streets | Promoting Travel Alternatives | Other | 2023 | 2027 | RBC/Schools | RBC/DFT/Schools | No | Part funded | < £10k | Implementation | Minor Regional benefits to NO2 and PM; encouraging travel alternatives | New schemes investigated | 4 schools streets implemented covering 7 schools. | |
| RDAQ8_Transport | Continue to promote active and low emission travel options | Promoting Travel Alternatives | All | 2023 | 2028 | RBC | RBC/DFT | No | Part funded | £50-£100k per annum | Implementation | Minor Regional benefits to NO2 and PM; encouraging travel alternatives | Numbers of people walking and cycling | ||
| RDAQ9_Transport | Multi-modal enhancements (Traffic corridor, IDR, Oxford Rd) | Traffic Management | Strategic highway improvements, Re-prioritising road space away from cars, inc Access management, Selective vehicle priority, bus priority, high vehicle occupancy lane | 2024 | 2028 | RBC | RBC/DFT | No | Part funded | £10-£15m (BSIP) | Implementation | Major Regional benefits to NO2 and PM | To improve wider connectivity with the outskirts of Reading, while reducing traffic congestion. | ||
| RDAQ10_Transport | Cross-Thames Travel Scheme | Traffic Management | Strategic highway improvements, Re-prioritising road space away from cars, inc Access management, Selective vehicle priority, bus priority, high vehicle occupancy lane | Major benefits to NO2 and PM on the IDR and existing bridges | Potential for new Thames crossing to the east of Reading, to alleviate congestion on the IDR and enable RDAQ17. | ||||||||||
| RDAQ11_Transport | Connecting Neighbourhoods | Traffic Management | Strategic highway improvements, Re-prioritising road space away from cars, inc Access management, Selective vehicle priority, bus priority, high vehicle occupancy lane | Moderate regional benefits to NO2 and PM | Plan is to enable more direct routes between neighbourhoods, key mobility hubs and employment areas, hopefully via sustainable transport improvements, to reduce through travel on the IDR. | ||||||||||
| RDAQ12_Transport | Concessionary and Discounted Travel for Students | Promoting Low Emission Transport | School Travel Plans | 2023 | 2025 | RBC/DFT | DFT | No | Funded | Implementation | Minor regional benefits to NO2 and PM | Discounted bus fares for young people, to discourage parents driving kids to schools | |||
| RDAQ13_Transport | Travel demand management charges | Traffic Management | Other | Minor regional benefits to NO2 and PM | Vehicles travelling through Reading (‘rat-runs’) without the need to be in Reading to be charged. | ||||||||||
| RDAQ14_Transport | Bus Rapid Transit Schemes | Traffic Management | Strategic highway improvements, Re-prioritising road space away from cars, inc Access management, Selective vehicle priority, bus priority, high vehicle occupancy lane | 2024 | 2028 | RBC | RBC/DFT | No | Part funded | £10-£15m (BSIP) | Implementation | Major regional benefits to NO2 and PM | Bus Rapid Transit Schemes from the South, Southeast, Southwest, East and West, to connect Central Reading to the wider town. | ||
| RDAQ15_Transport | Park and Ride Expansions | Alternatives to Private Vehicle Use | Bus based Park & Ride | 2024 | 2025 | RBC | RBC/DfT | No | Part Funded | £500k | Implementation | Moderate regional benefits to NO2 and PM | |||
| RDAQ16_Transport | New pedestrian and cycling routes | Transport planning and Infrastructure | Cycle network/ Other | 2024 | 2028 | RBC | RBC/DFT | No | Part funded | £1-£5m (Active Travel England Tranche Funding)) | Implementation | Minor regional benefits to NO2 and PM; better enabling alternatives to private vehicle use | In line with Local Cycling and Walking Infrastructure Plan | ||
| RDAQ17_Transport | Freight and Delivery. Investigate Introduction of last mile, low emission delivery | Freight and Delivery Management | Delivery and Service Plans | Minor regional benefits to NO2 and PM | Such as encouraging ‘last-mile’ deliveries to be made by zero-emission vehicles |
| Measure No. | Measure | Category | Classification | Estimated Year Measure to be Introduced | Estimated / Actual Completion Year | Organisations Involved | Funding Source | Defra AQ Grant Funding | Funding Status | Estimated Cost of Measure | Measure Status | Target Reduction in Pollutant / Emission from Measure | Key Performance Indicator | Progress to Date | Comments / Potential Barriers to Implementation |
| RDAQ20_Policy | Air quality planning guidance for construction sites and operational developments | Policy Guidance and Development Control | Air Quality Planning and Policy Guidance | 2024 | 2025 | RBC | RBC | No | Not funded | < £10k | Planning | Moderate Regional benefits to NO2 and PM; limits air quality impacts of new developments | Implementation of policy | ||
| RDAQ21_Policy | Wood burning policy and expansion of Smoke Control Area | Policy Guidance and Development Control | Other | 2023 | 2024 | RBC | RBC | No | Not funded | < £10k | Implementation | Moderate Regional benefits to PM; reducing domestic combustion pollutant contributions | Expansion of SCA, Implementation of policy | Public consultation process undertaken | |
| RDAQ22_Policy | Use of Wood Burning Enforcement Powers | Policy Guidance and Development Control | Other | 2024 | ongoing | RBC | RBC | No | Not funded | <10k | Planning | Minor regional benefits to PM | Number of enforcement actions taken | ||
| RDAQ23_Policy | Retrofitting Buildings to support Net Zero Ambitions | Policy Guidance and Development Control | Other | 2023 | ongoing | RBC | No | Minor regional benefits to NO2 | Number of buildings retrofitted | In line with ambitions of Reading Climate Action Network. This should reduce the need to rely on gas boilers and solid fuel burning | |||||
| RDAQ24_Policy | Encourage commercial cooking establishments to incorporate fine particulate filtration systems in their vents | Policy Guidance and Development Control | Other | 2025 | ongoing | RBC | RBC | No | Not funded | <10k | Planning | Minor regional benefits to PM | Number of businesses reached, percentage of businesses with filtrations systems | ||
| RDAQ25_Policy | Develop a Non-Road Mobile Machinery Emissions Policy | Policy Guidance and Development Control | Air Quality Planning and Policy Guidance | 2025 | 2026 | RBC | RBC | No | Not funded | <10k | Planning | Minor regional benefits to PM | Implementation of policy | London have stringent NRMM policies in place to ensure heavy construction vehicles use as low-emission technologies as practically possible, which could be replicated in Reading |
Table 5.3 ‒ Air Quality Action Plan Measures: Public Health and Awareness
| Measure No. | Measure | Category | Classification | Estimated Year Measure to be Introduced | Estimated / Actual Completion Year | Organisations Involved | Funding Source | Defra AQ Grant Funding | Funding Status | Estimated Cost of Measure | Measure Status | Target Reduction in Pollutant / Emission from Measure | Key Performance Indicator | Progress to Date | Comments / Potential Barriers to Implementation |
| RDAQ26_Public | Air Alert service (pollution warning service) | Public information | Via other mechanisms | 2024 | 2024 | RBC | RBC/Defra | no | Not funded | £5k CAPEX, £5k OPEX | Planning | No direct influence on pollutant concentrations, but provides the public with the opportunity to better protect themselves from pollution spikes | Implementation, number of subscriptions. | Part of AQ grant bid | Ongoing cost of running service |
| RDAQ27_Public | School awareness events | Promoting Travel Alternatives | Other | 2023 | 2027 | RBC/Design Nature/University of Reading/ Stantec | AQ Grant | yes | Funded | £100k-£300k | Planning | No direct influence on pollutant concentrations, but increases awareness | Number of school/pupils reached | AQ grant secured. Programme in development. | |
| RDAQ28_Public | Health promotion work with NHS | Public information | Other | 2023 | 2027 | RBC/NHS/PHE | no | Not funded | £100k-£200k | Planning | No direct influence on pollutant concentrations, but increases awareness | ||||
| RDAQ29_Public | Mobility as a Service (MaaS) scheme | Public Information | Via other mechanisms | 2023 | 2027 | RBC | no | Not funded | Planning | Minor regional benefits to NO2 and PM | Enable travellers to reach destinations confidently and conveniently, without the need for private vehicles, utilising a user-friendly transport services mobile app | ||||
| RDAQ30_Public | Increase PM2.5 Monitoring to help understanding of levels and sources in Reading | Public Information | Other | 2024 | 2028 | RBC/Defra/EA | RBC/EA | no | Not funded | 100k-500k | Planning | No direct influence on pollutant concentrations, but enables greater understanding to better target measures in the future | Number of monitoring locations | AQ grant application submitted, EA planning to install monitoring station | Carry out monitoring of PM2.5 at more locations in Reading, to better understand current situation and trends. |
| RDAQ31_Public | Smoke Control Area Awareness Campaign | Public Information | Other | 2023 | 2025 | RBC/Defra | RBC | no | Not funded | <10K | Planning | No direct influence on pollutant concentrations, but improves awareness | Publicity measures taken, surveys. | Information on RBC website | Develop and deliver awareness campaign to educate residents of the adverse air quality impacts of solid fuel burning. Materials re-published every winter for maximum impact. |
| RDAQ32_Public | Bonfire/ garden waste fire awareness campaign | Public Information | Other | 2024 | 2026 | RBC | RBC | no | Not funded | <10K | Planning | No direct influence on pollutant concentrations, but improves awareness | Publicity measures taken, letters sent. | Develop and deliver awareness campaign to educate residents of the adverse air quality impacts of burning garden waste/ bonfires. Materials re-published every autumn for maximum impact. | |
| RDAQ33_Public | Engagement in National Clean Air Day | Public information | Other | 2024 | ongoing | RBC | RBC | no | Not funded | <10k | Planning | No direct influence on pollutant concentrations, but improves awareness | Events held locally, Publicity of campaign. | Encourage schools to be engaged in the topic of air quality. Awareness raising for residents. | |
| RDAQ34_Public | Indoor Air Quality Awareness Campaign | Public Information | Other | 2025 | ongoing | RBC | RBC | no | Not funded | <10k | Planning | No direct influence on pollutant concentrations, but improves awareness | Publicity measures taken, surveys. | Knowledge of the importance of indoor air quality is starting to pick up traction, but public awareness remains limited. No targets or legislation in place. |
Appendix A: Response to consultation
| Consultee | Category | Response |
Appendix B: Reasons for not pursuing action plan measures
| Action category | Action description | Reason action is not being pursued (including Stakeholder views) |
Appendix C: Current UK air quality standards and objectives
Part IV of the Environment Act 1995 requires the Secretary of State to publish a national Air Quality Strategy and gave Local Authorities statutory duties to implement the system of LAQM.
The 2008 Ambient Air Quality Directive (ED/2008/50/EC) sets legally binding limits for concentrations in outdoor air for major air pollutants that impact public health such as particulate matter (PM10 and PM2.5) and nitrogen dioxide (NO2), to be met before 2010. These directive air quality limits were transposed into UK law and are set out in the Air Quality Strategy as provided in Table C.
| Pollutant | Averaging period | Air Quality Standard (AQS)(μg/m3) | Air Quality Objective (AQO) |
|---|---|---|---|
| Nitrogen dioxide (NO2) | 1 hour | 200 | 200 μg/m3 not to be exceeded more than 18 times a year |
| Nitrogen dioxide (NO2) | Annual | 40 | 40 μg/m3 |
| Particulate Matter (PM10) | 24 hour | 50 | 50 μg/m3 not to be exceeded more than 35 times a year |
| Particulate Matter (PM10) | Annual | 40 | 40 μg/m3 |
| Particulate Matter (PM2.5) | Annual | 20 | 20 μg/m3 |
The objectives adopted in the UK are based on the Air Quality (England) Regulations 2000, as amended, for the purpose of Local Air Quality Management. These Air Quality Regulations have been adopted into UK law from the limit values required by European Union Daughter Directives on air quality.
The UKAQS for PM2.5 was amended as part of The Environment (Miscellaneous Amendments) (EU Exit) Regulations 2020.
The LAQM process requires all local authorities to regularly review and assess air quality in their areas, and to determine whether the air quality objectives are likely to be achieved. Where an exceedance is considered likely the local authority must declare an Air Quality Management Area (AQMA) and prepare an Air Quality Action Plan (AQAP) setting out the measures it intends to put in place in pursuit of the objectives.
Glossary of terms
| Abbreviation | Description |
| AQAP | Air Quality Action Plan – A detailed description of measures, outcomes, achievement dates and implementation methods, showing how the local authority intends to achieve air quality limit values’ |
| AQMA | Air Quality Management Area – An area where air pollutant concentrations exceed / are likely to exceed the relevant air quality objectives. AQMAs are declared for specific pollutants and objectives |
| AQS | Air Quality Strategy |
| AQO | Air Quality Objective |
| ASR | Air Quality Annual Status Report |
| Defra | Department for Environment, Food and Rural Affairs |
| EU | European Union |
| WHO | World Health Organisation |
| LAQM | Local Air Quality Management |
| NO2 | Nitrogen Dioxide |
| NOx | Nitrogen Oxides |
| PM10 | Airborne particulate matter with an aerodynamic diameter of 10µm (micrometres or microns) or less |
| PM2.5 | Airborne particulate matter with an aerodynamic diameter of 2.5µm or less |
| O3 | Ozone |
| BRT Corridor | Bus Rapid Transit Corridor |
| IDR | Reading’s Inner Distribution Road which surrounds central Reading |
| AURN | Defra’s Automatic Urban and Rural Network of monitoring stations |
| AQMS | Air Quality Monitoring Station |
| NPPF | National Planning Policy Framework |
| TDP | Reading’s Transport Decarbonisation Plan |
| DfT | Department for Transport |
| LGV | Light Goods Vehicle – goods vehicles weighing less than 3.5 tonnes. |
| HGV | Heavy Goods Vehicle – goods vehicles weighing greater than 3.5 tonnes. |
| UK-AIR | Defra’s UK Air Information Resource |
| AQSG | Reading’s Air Quality Steering Group |
| EV | Electric Vehicle |
[1] Environmental equity, air quality, socioeconomic status and respiratory health, 2010
[2] Air quality and social deprivation in the UK: an environmental inequalities analysis, 2006
[3] Defra. Abatement cost guidance for valuing changes in air quality, May 2013
[4] AURN – Automatic Urban and Rural Network AQMS operated by Defra.
[5] The Air Quality Expert Group (AQEG) issued a rapid review in June 2020 on the estimation of changes in air pollution emissions, concentrations, and exposure during the COVID-19 outbreak in the UK. The document acknowledges that there is some evidence to suggest that nitrogen dioxide (NO2), particulate matter (PM) and ozone (O3) may increase susceptibility to respiratory infections or worsen disease prognosis, although it recognises that there are still insufficient studies or mixed evidence for specific combinations of endpoints, infection types, age groups or pollutants.
[6] R Core Team (2023). _R: A Language and Environment for Statistical Computing_. R Foundation for Statistical Computing, Vienna, Austria. <https://www.R-project.org/>.
[7] Carslaw, DC. and Ropkins, K. (2012). Openair – an R package for air quality data analysis.
[8] Reading Borough Council and Phlorum Limited. (2020). Reading AQAP-Covid Data Review
[9] This figure forms part of the Guidance “Health Matters: air pollution”, which was published by Public England on their website on 14th November 2018.
[10] WHO (2023). Air Quality and Health. https://www.who.int/teams/environment-climate-change-and-health/air-quality-and-health/health-impacts/exposure-air-pollution
[11] Barnes et al (2019) Emissions vs exposure: Increasing injustice from road traffic-related air pollution in the United Kingdom.
[12] The ONS acknowledges air pollution is one of many factors that may be driving disproportionate outcomes for black, Asian and minority ethnic (BAME) people – Ethnicity is strongly correlated with pollution exposure in England, with ethnic minorities more likely to live in polluted areas.
[13] Department for Communities and Local Government (DCLG), (2021), National Planning Policy Framework.
[14]UK Govt Department for Transport (2018) https://assets.publishing.service.gov.uk/government/uploads/system/uploads/attachment_data/file/739460/road-to-zero.pdf
[15] DfT (2021), Decarbonising transport: a better, greener Britain. Available at: https://assets.publishing.service.gov.uk/government/uploads/system/uploads/attachment_data/file/1002285/decarbonising-transport-a-better-greener-britain.pdf
[16] DfT (2021) Heavy goods vehicles: ending the sale of new non-zero emission models. Available at: https://www.gov.uk/government/consultations/heavy-goods-vehicles-ending-the-sale-of-new-non-zero-emission-models
[17] Defra (2019). Clean Air Strategy 2019. Accessible at https://assets.publishing.service.gov.uk/government/uploads/system/uploads/attachment_data/file/770715/clean-air-strategy-2019.pdf
[18] Uk Govt (2021). Environment Act 2021
[19] Defra (2023). Air Quality Strategy – Framework for Local Authority Delivery. Accessible at https://assets.publishing.service.gov.uk/government/uploads/system/uploads/attachment_data/file/1180706/Air_Quality_Strategy_Web.pdf
[20] Govt (2023). Environmental Improvement Plan 2023. Accessible at https://assets.publishing.service.gov.uk/government/uploads/system/uploads/attachment_data/file/1168372/environmental-improvement-plan-2023.pdf
[21] Reading Borough Council (2019). Reading Borough Local Plan – Adopted November 2019.
[22] DfT (2023). Road Traffic Statistics. Accessible at https://roadtraffic.dft.gov.uk/#6/55.250/-1.000/basemap-regions-countpoints
[23] Defra: UK-AIR. www.uk-air.defra.gov.uk
[24] Defra (2023). National Statistics: Emissions of air pollutants in the UK – Particulate Matter (PM10 and PM2.5).
[25] PHE (2019). Review of Intervention to Improve Outdoor Air Quality and Public Health.
[26] Defra. (2022). Part IV of the Environment Act 1995, Environment (Northern Ireland) Order 2002 Part III, Local Air Quality Management, Technical Guidance LAQM. TG(22). London: Defra.
Last updated on 24/04/2026
2024 – 2029 Air quality action plan